Find the upcoming dates on this page.

Previous Talks

Speaker: Prof. Steffen Frey

Abstract

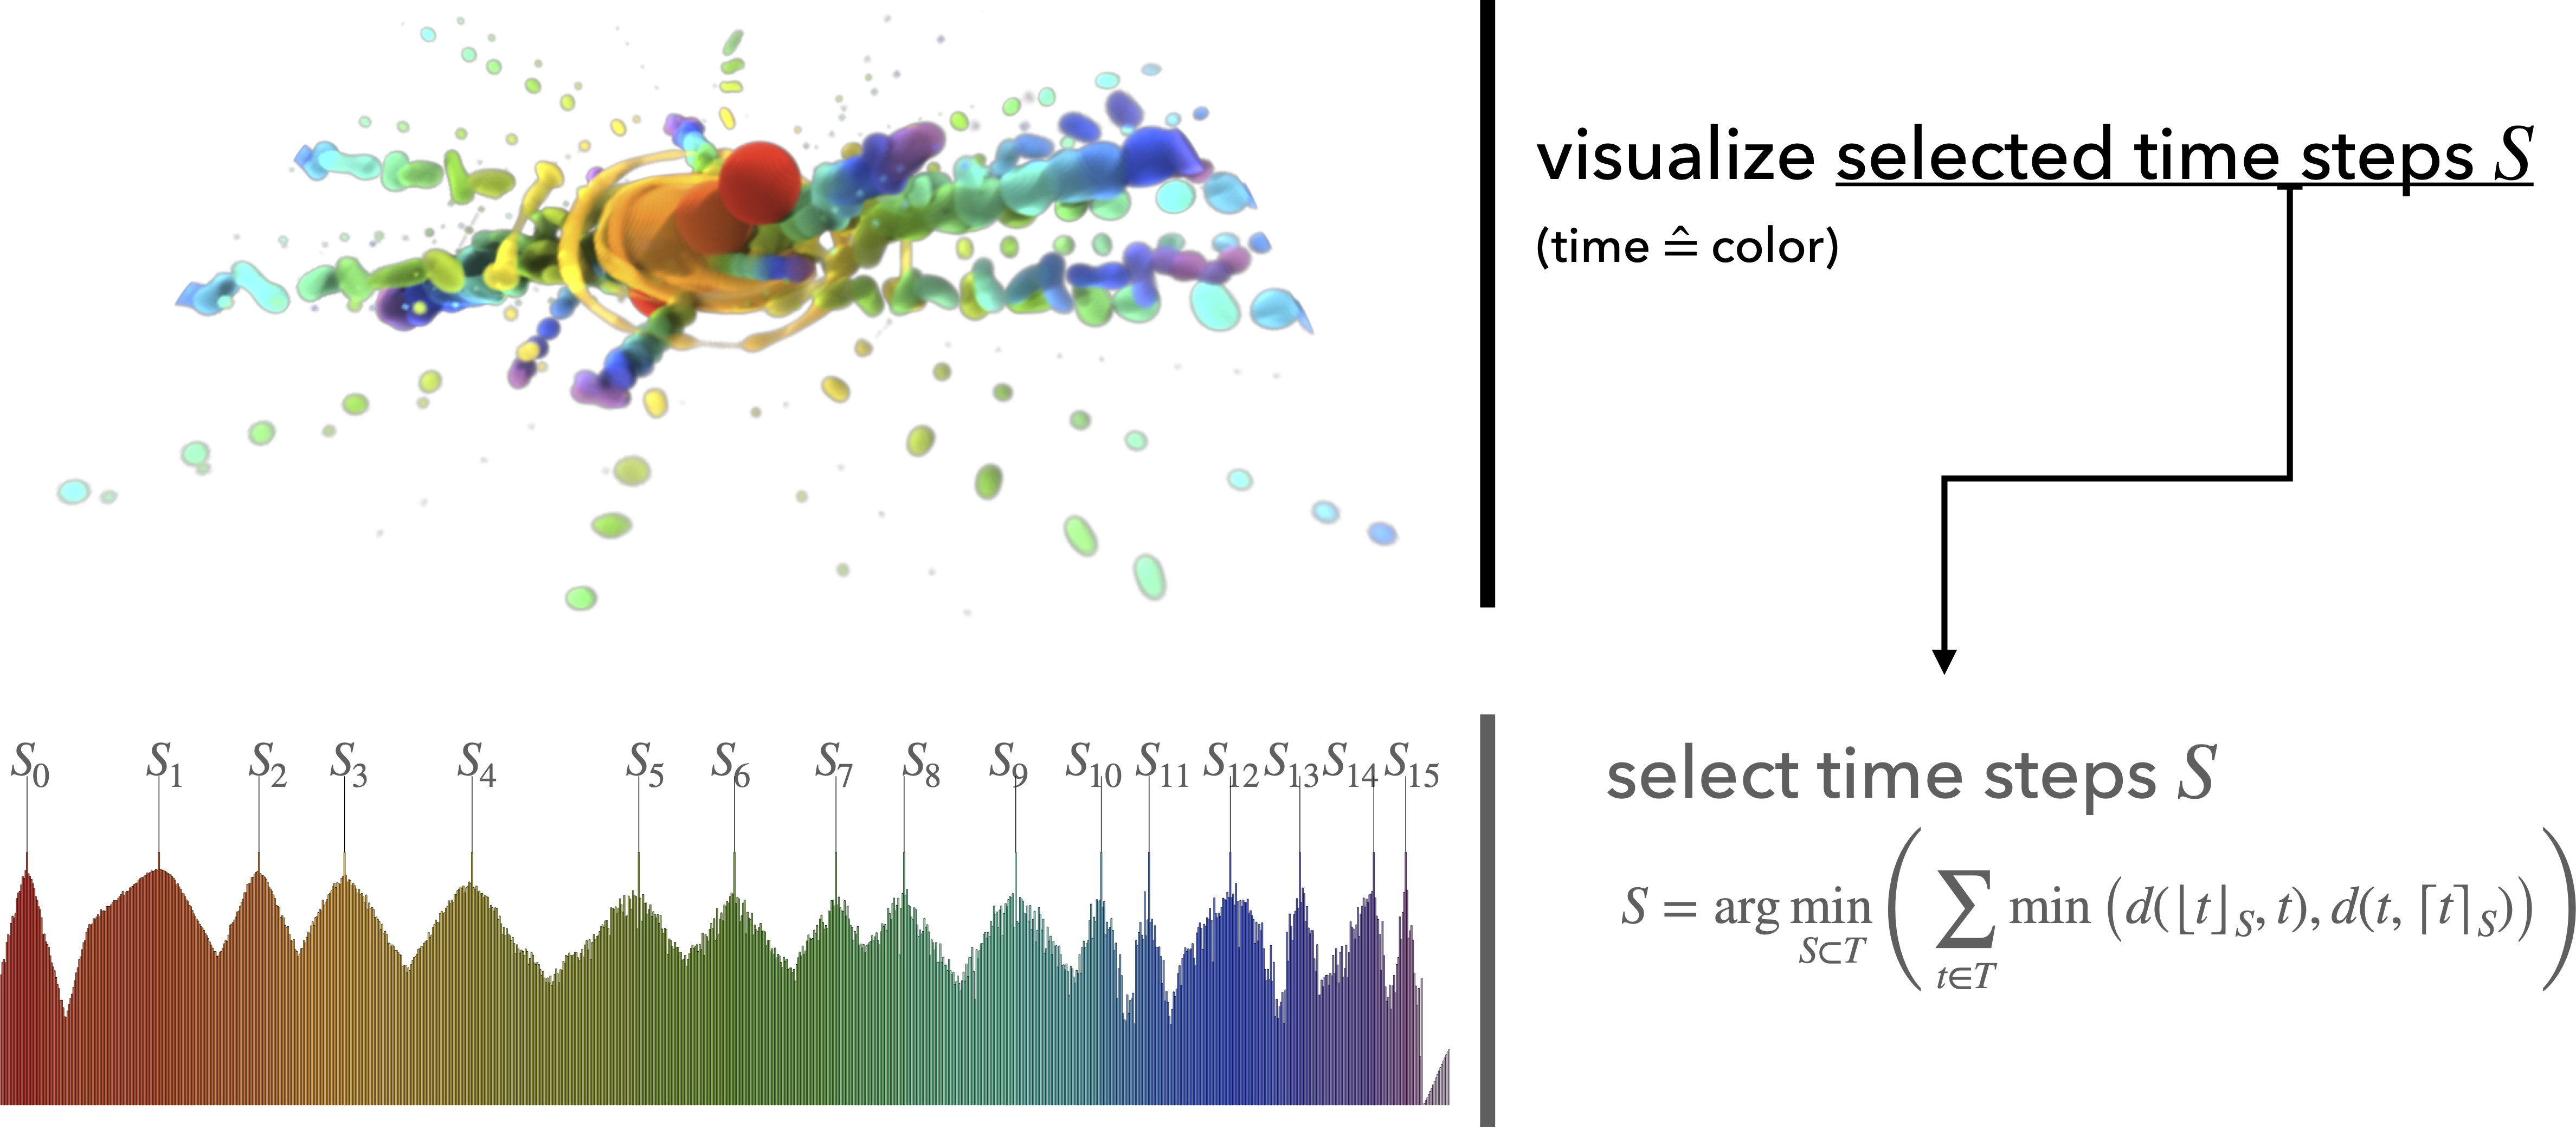
The rapid growth of data presents both opportunities and challenges for visualization. Mathematical optimization provides a robust framework to address these challenges by formulating visualization tasks as solvable problems. In this talk, we explore through concrete examples how optimization enhances visual data analysis, considering involved objectives (and their quantification), parameter spaces, and optimization approaches. We examine a range of problems, including time-dependent volume data analysis and in situ visualization scheduling, with an emphasis on grid layouts for visual clustering, anomaly detection, and exploration. The talk concludes by summarizing common themes and discussing emerging trends to enable visualization systems to handle increasingly complex and large datasets.

Bio

My research focuses on developing methods to gain insights from large scientific data, typically originating from experiments and simulations. Here, largerefers to data size, resolution, number of elements or fields, or combinations thereof. Meaningful analysis requires addressing challenges related both to presentation and to performance, and thus involves diverse—but closely interconnected—research directions. These include machine learning and optimization for visualization, high-performance computing (distributed and parallel approaches, in situ visualization), and multifield visualization. An overarching theme of my work is the automatic, data-driven configuration of visualization methods and systems.
Details

Category

Duration

45 + 15
Host: Erduard Gröller

Speaker: Prof. Bernhard Preim

Abstract

In this talk I will discuss modern science communication and the role of narrative visualization, using different narrative genres, such as InfoGraphics as they are used in visual abstracts. In the core part of the talk, I motivate narrative medical visualization aiming at broad audiences and patients and discuss selected aspects and applications of narrative medical visualization, such as the role and specific design of characters and stories related to preventable risk factors. I will emphasize re-usable strategies and components, including story templates and AI-generated character generation.

Bio

Bernhard Preim is a German computer scientist specializing in medical visualization. He studied computer science with a minor in mathematics and completed his PhD in 1998 at the University of Magdeburg. After working at Fraunhofer MEVIS in Bremen, where he led research on computer-assisted surgical planning, he habilitated in 2002 and has been a professor of visualization at the University of Magdeburg since 2003. His research focuses on algorithms and applications in medical visualization, and he has authored several influential textbooks in the field. Preim has also played a major role in the scientific community through founding initiatives, conference organization, editorial work, and leadership positions in professional societies related to visual computing and computer-assisted surgery.

Attachments

Details

Category

Duration

45 + 15
Host: Eduard Gröller

Speaker: Prof. Helwig Hauser

Abstract

Interactive visual data exploration is wide-spread in data science – not only as part of hypothesis generation, but also when prototyping appropriate analysis workflows. Interactive visualization is a key ingredient and a solid foundation of useful methods – both through appropriate visual repre-sentations as well as due to user interaction techniques, including coordinated multiple views, link-ing and brushing, focus+context visualization, etc. 

In this talk, we take a look at the role of interaction in visual data science. We examine potential benefits – for example, how interactive visualization becomes part of externalization, enabling and supporting complementary levels of cognition during data exploration – as well as possible down-sides (human-in-the-loop processes are potentially costly, requiring the user's time, for example). We review also, how interactive visualization can be understood as a form of dialogue between the analyst and her/his data and we analyze, which requirements – primarily in the temporal sense – are faced when establishing an effective and efficient interaction. 

Besides an overview of selected examples from published work in visualization research, we also considered a few examples from own work on interactive visual data exploration and analysis, in-cluding a demonstration of how deep learning can help to optimize user interaction in visualization. 

Bio

Helwig Hauser is professor in visualization and the (co-)leader of the Center for Data Science, CEDAS, at the University of Bergen (UiB), Norway. Before joining UiB in 2007 to build up a new research group on visualization (vis.UiB.no), Helwig Hauser was the Scientific Director of the VRVis Research Center in Vienna, Austria, where he earlier led the basic research group on visualization (since 2000). Helwig Hauser got his education (in Computer Science, with specialization on visualization) from the Vienna University of Technology in Austria (TU Wien), where he also completed his PhD in 1998 and his Habilitation in 2003 (later awarded by the Heinz Zemanek Award). Since 2019, Helwig Hauser is the (co-)leader of UiB’s Center for Data Science, CEDAS (UiB.no/cedas), with focus on interdiscipli-nary research in data science, as well as data science education and applications. His interests are broad within visualization, visual data science, and related fields, and he’s an active member of the international visualization community, having served / serving, for ex., as the Editor in Chief for jour-nal Computer Graphics Forum, as Overall Paper Chair for the IEEE VIS conference, as well as on a variety of Steering Committees. 

Details

Category

Duration

45 + 15
Host: Eduard Gröller

Speaker: Prof. Dr. Alexandra Diehl

Abstract

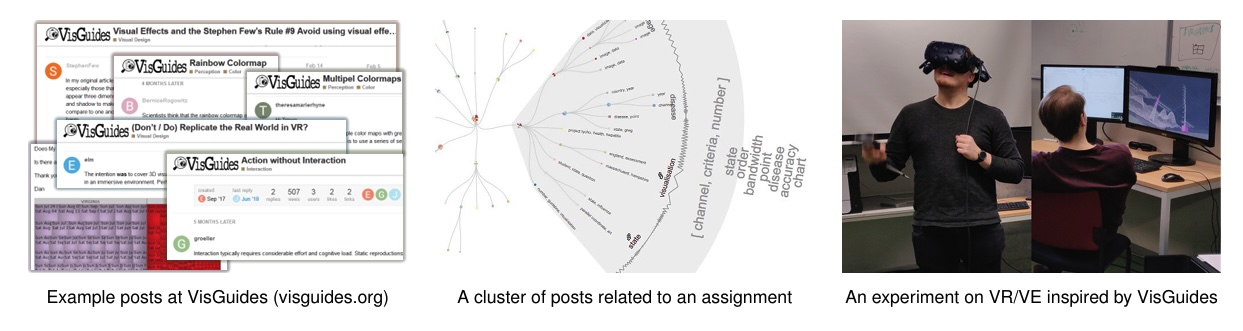
Visualization guidelines play a central role in shaping both practical visualization design and the theoretical foundations of our field. Yet despite their ubiquity, many guidelines remain imprecise, weakly contextualized, or insufficiently scrutinized. In this talk, I will reflect on several years of research dedicated to studying, formalizing, and empirically grounding visualization guidelines through the lens of Grounded Theory (GT). Drawing on discourses from VisGuides, an online forum dedicated to visualization guidelines, we developed a multi‑layered research program that combines traditional GT practices—such as open and axial coding, constant comparison, and negative case analysis—with computer‑assisted text analysis, visualization techniques, and controlled empirical studies. This work has enabled us to characterize how guidelines are discussed, interpreted, and applied in practice; to uncover implicit assumptions and contextual dependencies; and to identify opportunities for refining existing guidelines or formulating new ones. By integrating GT with visualization methods and empirical validation, we demonstrate how a data‑driven, theory‑building approach can strengthen the conceptual foundations of visualization and support the long‑term curation and evolution of visualization guidelines.

Bio

Alexandra Diehl is an Associate Professor at the University of Southern Denmark, where she teaches data visualization and conducts research at the intersection of two complementary areas: the study of visualization best practices and guidelines, and the application of visual analytics to weather and environmental science. Her work brings together qualitative and quantitative methods to understand how visualization guidelines are formulated, interpreted, and validated, and how to apply them in the context of visual analytics to support domain experts in high‑stakes decision‑making.

Before joining SDU, Dr. Diehl was part of the Visualization and Multimedia Analysis Lab at the University of Zurich and the Data Analysis and Visualization Group at the University of Konstanz. 

Dr. Diehl holds a Ph.D. in Computer Science from the University of Buenos Aires. Her research spans visualization guidelines, visual analytics, and environmental visualization, with a strong emphasis on interdisciplinary collaboration and methodological rigor. More information is available at https://www.alexandra-diehl.science/. 

Details

Category

Duration

45 + 15
Host: Eduard Gröller

Speaker: Min Lu (Shenzhen University, China)

Abstract

Visualization transforms abstract data into visual forms to enhance human understanding. Its design has long relied on heuristic principles to create effective representations. In this talk, I will present our research journey, which ranges from principle-guided visual designs to generative AI-assisted methods. I will demonstrate how we leverage intelligent systems for automated layout, vectorization, and stylization, and will conclude with a new framework for AI-driven visualization design.

Bio

Min Lu is an Associate Professor at Shenzhen University, China, where she leads the Spatial Creative Intelligence and Interaction (SCII) Research Group. Her research focuses on AI-driven stylized design generation and interaction. She has published papers at top-tier conferences including SIGGRAPH, CVPR, IEEE VIS, and ACM CHI, and holds two grants from the National Natural Science Foundation of China (NSFC). Her work has been recognized with awards such as Best Paper Honorable Mentions at IEEE PacificVis 2024 and CVM 2020. She also serves on the program committees for ACM SIGGRAPH Asia, IEEE PacificVis, and ChinaVis. More information is available at: https://deardeer.github.io/.

Details

Category

Duration

30 + 15
Host: Michael Wimmer

Speaker: Daniel Cohen-Or (Tel Aviv University)

Abstract

Attention layers play a critical role in generative models. In this talk, I will show that these layers capture rich semantic information, and particularly semantic correspondences between elements within the image and across different images. Through several works, I will show that the rich representations learned by these layers can be leveraged for image manipulation, consistent image generation, and personalization. Additionally, I will discuss the challenges that arise, especially in scenarios involving complex prompts with multiple subjects. Specific issues, such as semantic leakage during the denoising process, can lead to inaccurate representations, resulting in poor generations.

Bio

Daniel Cohen-Or is a professor in the School of Computer Science. He received his B.Sc. cum laude in both mathematics and computer science (1985), and M.Sc. cum laude in computer science (1986) from Ben-Gurion University, and Ph.D. from the Department of Computer Science (1991) at State University of New York at Stony Brook. He was sitting on the editorial board of a number of international journals, and a member of the program committees of several international conferences. He was the recipient of the Eurographics Outstanding Technical Contributions Award in 2005. In 2013 he received The People’s Republic of China Friendship Award. In 2015 he was named a Thomson Reuters Highly Cited Researcher? He received the ACM SIGGRAPH Computer Graphics Achievement Award in 2018. In 2019 he won The Kadar Family Award for Outstanding Research. In 2020, he received The Eurographics Distinguished Career Award. His research interests are in computer graphics, in particular, synthesis, processing and modelling techniques.

Details

Category

Duration

30 + 15
Host: Michael Wimmer

Speaker: Prof. Wanda Benešová PhD.

Abstract

This presentation introduces the Vision and Graphics Group from the Faculty of Informatics and Information Technologies at the Slovak University of Technology in Bratislava. I will outline the group’s key research objectives and highlight potential avenues for collaboration. The focus of the presentation centers on current projects in computer vision for digital pathology (histology), emphasizing the application of artificial intelligence (AI) methods. Additionally, we present research tasks involving AI-driven solutions in radiology, showcasing the group’s contributions to medical image analysis and diagnostic support.

Bio

Professor Wanda Benešová is a faculty member at the Slovak University of Technology in Bratislava (STU), Faculty of Informatics and Information Technologies, where she is actively involved in both teaching and research activities. She also maintains a professional affiliation at the Czech Technical University in Prague (CTU).

Earlier in her career, Professor Benešová held a research position at the Joanneum Research Institute in Graz within the Institute of Digital Image Processing. She was also employed at the CD Labor at the University of Leoben, working under the supervision of Professor Paul O’Leary, and she gained further professional experience at the company LEM Norma.

Her scientific work is primarily focused on the field of computer vision, especially on medical image processing using methods of deep learning. She founded and currently heads the” Vision & Graphics Group” at the Faculty of Informatics and Information Technologies STU (http://vgg.fiit.stuba.sk).

Details

Category

Duration

20 + 10
Host: Martin Ilčík

Speaker: DI Anja Heim

Abstract

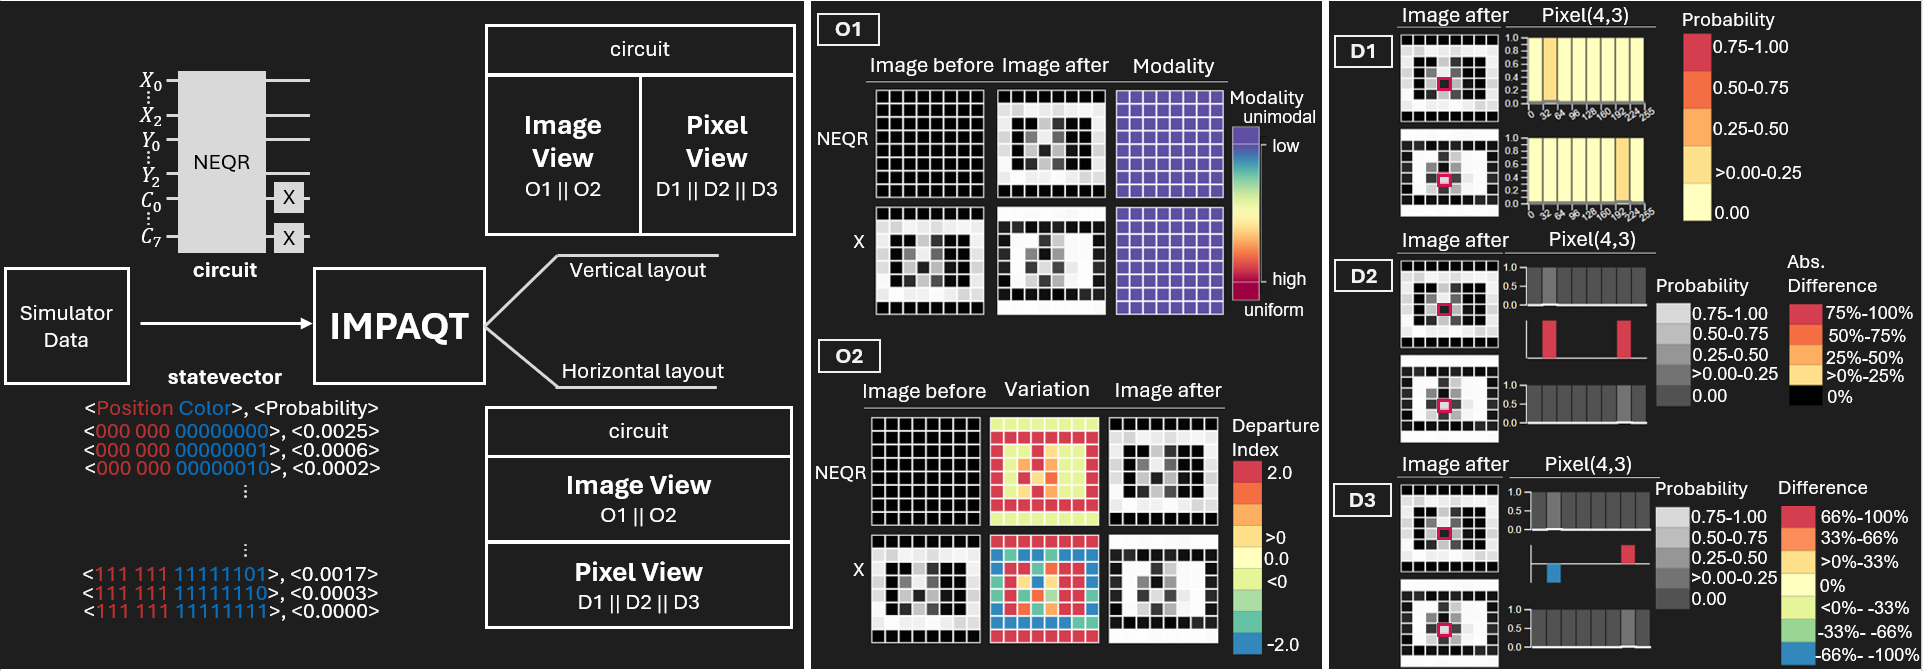
Visualizing data distributions is crucial for understanding complex materials science datasets, especially those derived from X-ray computed tomography (XCT). These visual analysis techniques support the exploration of structural properties and temporal developments in high-dimensional data. A promising future approach for efficiently handling such XCT data is quantum image processing, which offers the potential to process entire images simultaneously through quantum parallelism. However, quantum image processing algorithms are difficult to develop because of the unintuitive nature of quantum mechanics.

 In this presentation, I will introduce IMPAQT, an interactive visualization system designed to facilitate the design, analysis, and debugging of quantum image processing algorithms. IMPAQT bridges the gap between complex quantum circuit behavior and interpretable image transformations, providing a clear and transparent view of the evolution of NEQR-encoded images. I will demonstrate how IMPAQT helps researchers understand gate-level operations and pixel-level effects, accelerating the development of reliable quantum image processing pipelines.

Bio

DI Anja Heim is a research associate at the Fraunhofer Institute for Integrated Circuits IIS, working in the Knowledge-Based Image Processing and Visualization (WBV) group. Previously, she worked for three years at the Computed Tomography Research Group at the University of Applied Sciences Upper Austria, Campus Wels. She holds a BSc in Media Informatics and Visual Computing and an MSc in Visual Computing from the Vienna University of Technology. Her master thesis focused on the visual comparison of multivariate data ensembles. Currently, she is working on her PhD project on the visual analysis of high-dimensional data distributions in different domains as materials science and quantum computing.

Details

Category

Duration

25 + 5
Host: Eduard Gröller

Speaker: Prof. Dr. Christoph Heinzl

Abstract

Visualization, analysis and exploration of rich X-ray computed tomography data, including large primary (e.g., projection images or volumetric XCT datasets) and secondary derived data (e.g., segmentation masks, labeled data, abstract or multivariate data), can be cumbersome and at times even impossible in traditional desktop-based setups. 

Yet, domain specialists require an in depth understanding of spatial data in its original data domain, considering abstract data on attributes of interest in various representations and levels of detail, despite and precisely because of their large size.

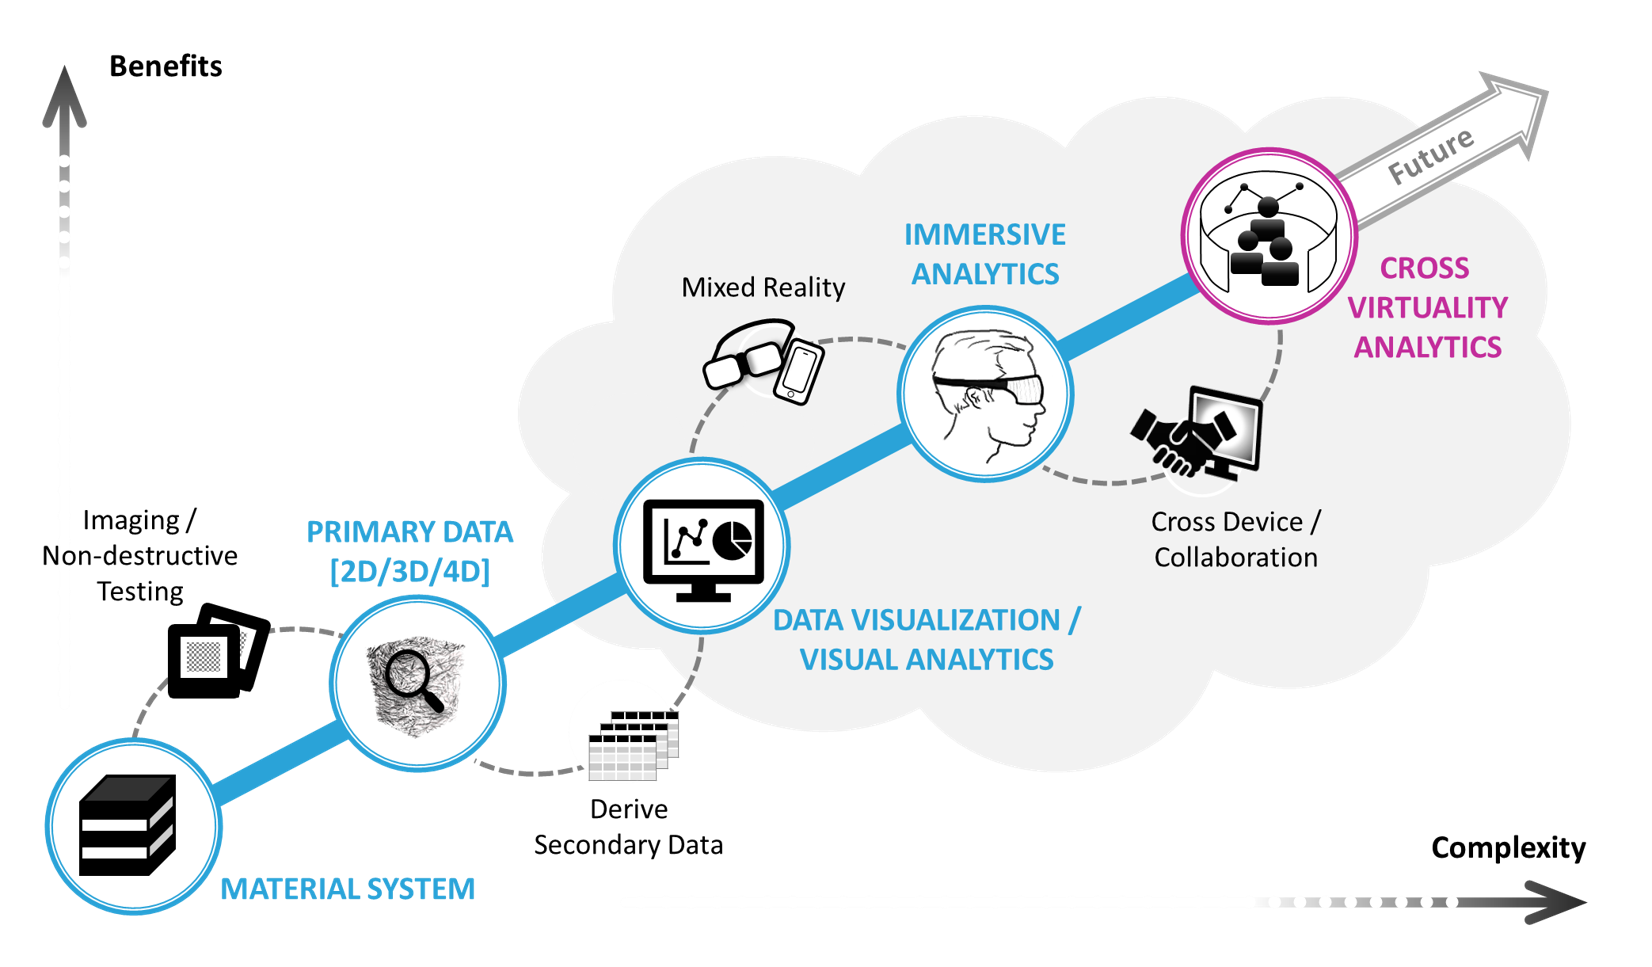
This talk aims to frame some of our research activities in this regard and spans the visualization pipeline from image generation to compression and segmentation, and visualization. Aside from multivariate data analysis, Cross virtuality analytics (XVA) will be addressed as an emerging field in materials science providing novel means for integrative analysis solutions. 

XVA enables visual analytics to explore data along the reality-virtuality continuum, individually or collaboratively. It aims to seamlessly integrate suitable visual metaphors, across different devices, and even supports multiple users in solving a joint analysis task. In a few design studies on virtual and augmented reality based immersive analytics techniques as well as a system integrating techniques along the reality-virtuality-continuum, this talk makes the claim, that cross virtuality analytics can provide novel insights into rich XCT data, which have not been possible before.

Bio

Prof. Dr. Christoph Heinzl received his PhD degree in computer science from TU Wien in the field of visualization and analysis of industrial XCT data. 

He was awarded the habilitation (venia docendi) from TU Wien in Computer Science in 2022. Aside being professor of cognitive sensor systems at University of Passau, he is leading the research group for knowledge-based image processing and visualization at the Fraunhofer IIS Development center X-ray technology. His research covers visual analysis and visualization of "rich" XCT data, a research domain, in which he published >100 papers, >36 of them peer-reviewed, four book chapters and a patent. He acquired various applied and basic research grants on national and European level (xCTing, X-Pro, AugmeNDT, COMPARE, BeyondInspection, NanoXCT, QUICOM, InteraQCT, ADAM, SmartCT, SimCT, etc.).

Details

Category

Duration

25 + 5
Host: Eduard Gröller

Speaker: Prof.'in Dr. Tatiana von Landesberger

Abstract:

Research in visualization is often motivated by the endeavor to improve on the illustration of data: in order to better communicate data to others and to gain deeper insights into data models, possibly from a variety of data sources. Individuals with varying backgrounds and statistical knowledge need to gain insights from data and models that are communicated visually either in public media or in data analysis tools. However, various data and models require special visualization techniques that build on human capabilities of perceiving the data and models well. In this talk,, I will focus on two challenges: 1) visual communication of data with large value ranges that span across several orders of magnitude. Examples include Covid-19 cases or meteorologic particles and 2) visual model validation and estimation - the ability of humans to validate computer-generated models and estimate models from the data visually. Examples include linear regressions of house prices or patient data. We present various techniques and results of user studies that provide insights into capabilities and limitations of human-centered visual data communication and model building. 

Speaker Biography:

Tatiana von Landesberger is a full professor of Computer Science – Visualization at University of Cologne, Germany. She received a PhD in 2010 and finished her habilitation in 2017 at TU Darmstadt, Germany. Her research focuses on information visualization and visual analytics of spatio-temporal and network data from various domains such as biology, medicine, finance, transportation, journalism or meteorology. Her recent research addresses the challenges of perception and cognition of visualization as well as visual analysis of disease spreading. She regularly publishes at top international conferences and has received multiple awards. Tatiana has served in program committees and organization committees for IEEE VIS, EuroVis, VMV and other venues. Recently, she was full paper chair at EuroVis and is now member of EuroVis steering committee and associate editor of Computer Graphics Forum.


Details

Category

Duration

45 + 15

Speaker: Hendrik Strobelt (Sr Research Scientist at MIT-IBM AI Lab)

With the increasing adoption of machine learning models across domains, we have to think about the roles of humans and AI to build trustworthy systems. In the last few years, my collaborators and I have created a series of tools that utilize visualization and visual user interaction to help investigate behavior of machine learning models. I will present a quick intro to trustworthy AI in general and will show some of these tools that demonstrate how intuitive ideas can foster human-AI collaboration − and therefore contribute to building trustworthy systems.

Details

Category

Duration

30 + 15
Host: Johanna Schmidt

Speaker: Prof. Amal Dev Parakkat (LTCI-Telecom Paris)

Abstract

In this talk, I will present different frameworks we developed using the geometric properties of Delaunay triangulation to process hand-drawn sketches. The presentation will focus on two key areas: sketch simplification (cleaning up rough sketches) and line art colorization (adding color to hand-drawn sketches, even those with gaps). I will demonstrate how our methods combine Delaunay triangulation with interactive user input to create powerful tools for enhancing hand-drawn sketches bridging the gap between initial rough concepts and refined digital representations. By the end of the presentation, you'll understand how our simple sketch-processing techniques can significantly benefit artists, designers, and digital content creators.


Bio 

Amal Dev Parakkat has been working as a tenured Assistant Professor (Maitre de Conferences in French) at LTCI-Telecom Paris, Institut Polytechnique de Paris, since September 2021. Parakkat was born in Kerala, India. He is interested in practical algorithms for digital content creation tasks with the main focus on Sketch-based interfaces. He also works on fundamental problems in digital geometry processing, including reconstruction and meshing. He leads the ANR SketchMAD project on novel algorithms for sketch-based modeling (2024–2028) and heads the IGD masters at the Institut Polytechnique de Paris. He received the SMI Young Investigators Award 2024 and regularly serves on program committees of Eurographics, Pacific Graphics, Shape Modeling International, and Computer Graphics International. He will be the technical paper chair of Expressive 2025.

Details

Category

Duration

40 + 10
Host: Michael Wimmer

Speaker: Laura Luidolt (Snap Inc.), Michael Hecher (Snap Inc.)

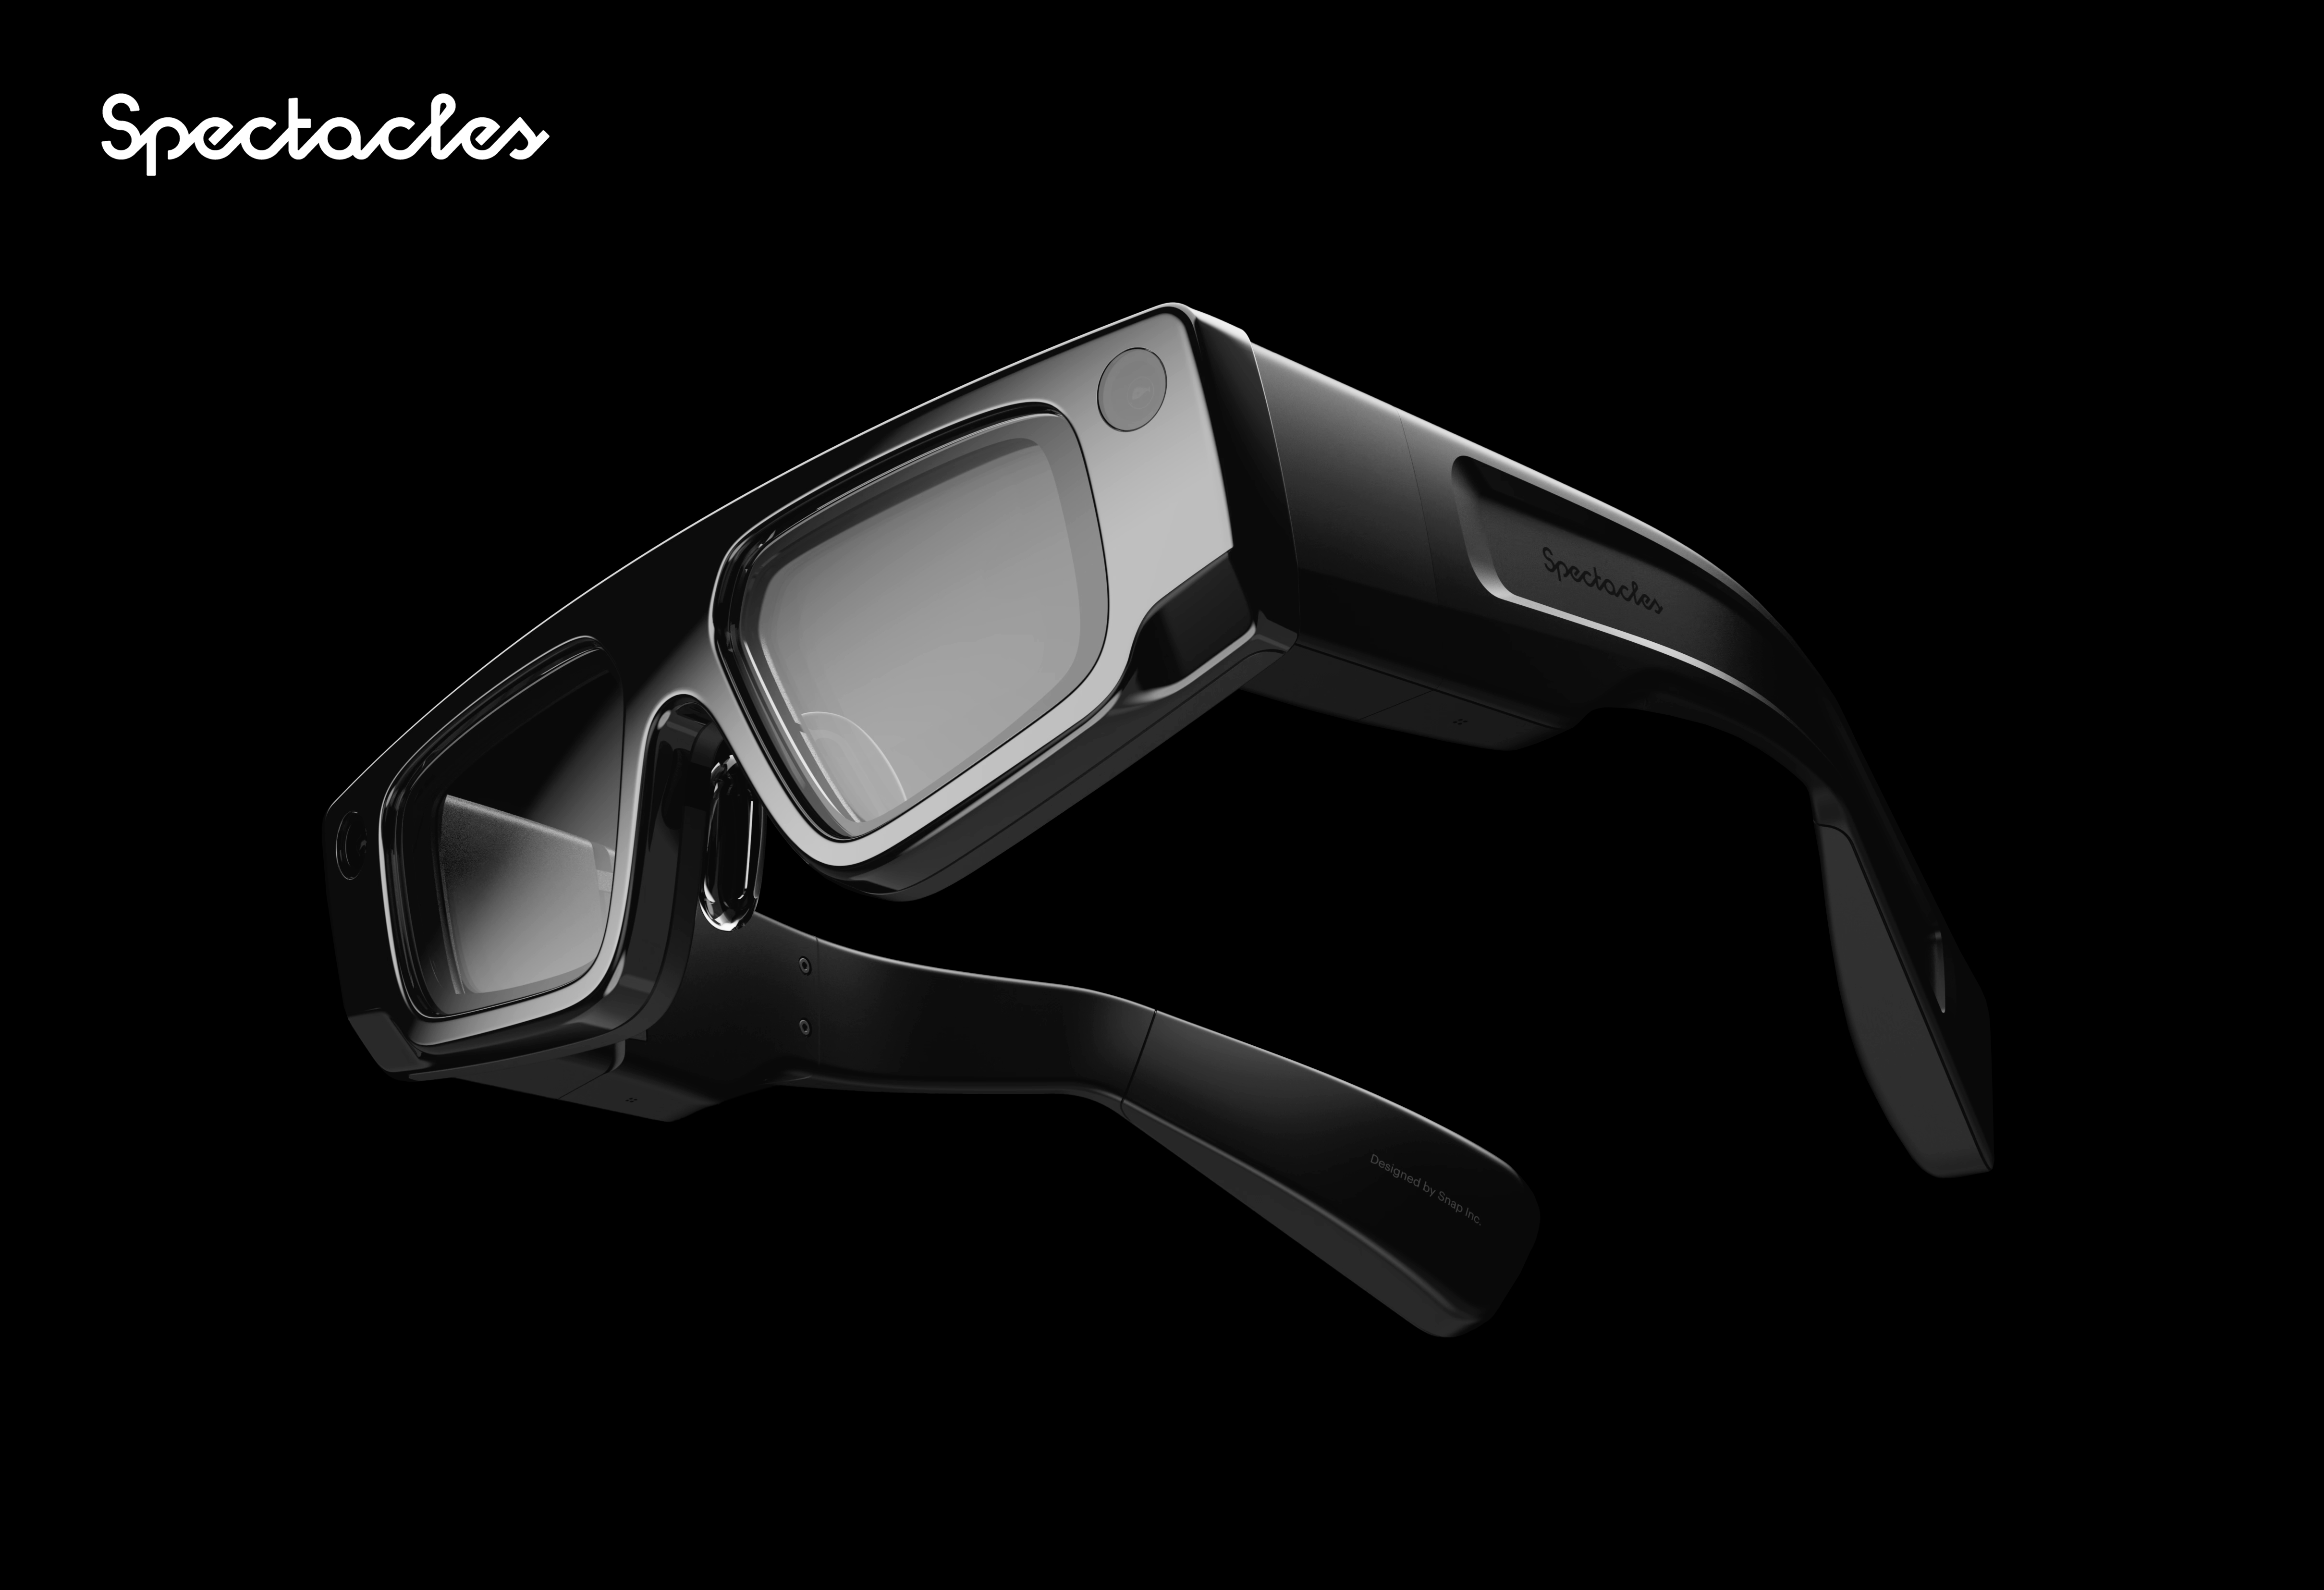
This exclusive Spectacles Demo session offers a rare opportunity to explore these AR glasses firsthand. Featuring a see-through stereo display with optical waveguides and liquid crystal on silicon (LCoS) miniature projectors, the glasses provide a 46° diagonal field of view and 37 pixels per degree resolution. The device has a 13ms latency ("motion to photon"), 6DoF tracking, 60Hz rendering, and 120Hz late stage reprojection frequency. Interact via full hand tracking, voice recognition, and an optional mobile app controller, all within a standalone untethered design. Powered by two Snapdragon processors for distributed computing, it allows up to 45 minutes of continuous runtime and includes both full color and infrared computer vision cameras. Weighing 226g, the glasses have a flexible folding temple design and an optional prescription insert. 

This event offers a unique chance to explore a device intended for the US AR-hobbyist market, that is not publicly available in Europe. Looking forward to answering all your questions and helping you explore the future of wearable tech. 

Details

Category

Duration

45+15
Host: Michael Wimmer

Speaker: Dr. Eric Mörth (Harvard Medical School, Biomedical Informatics)

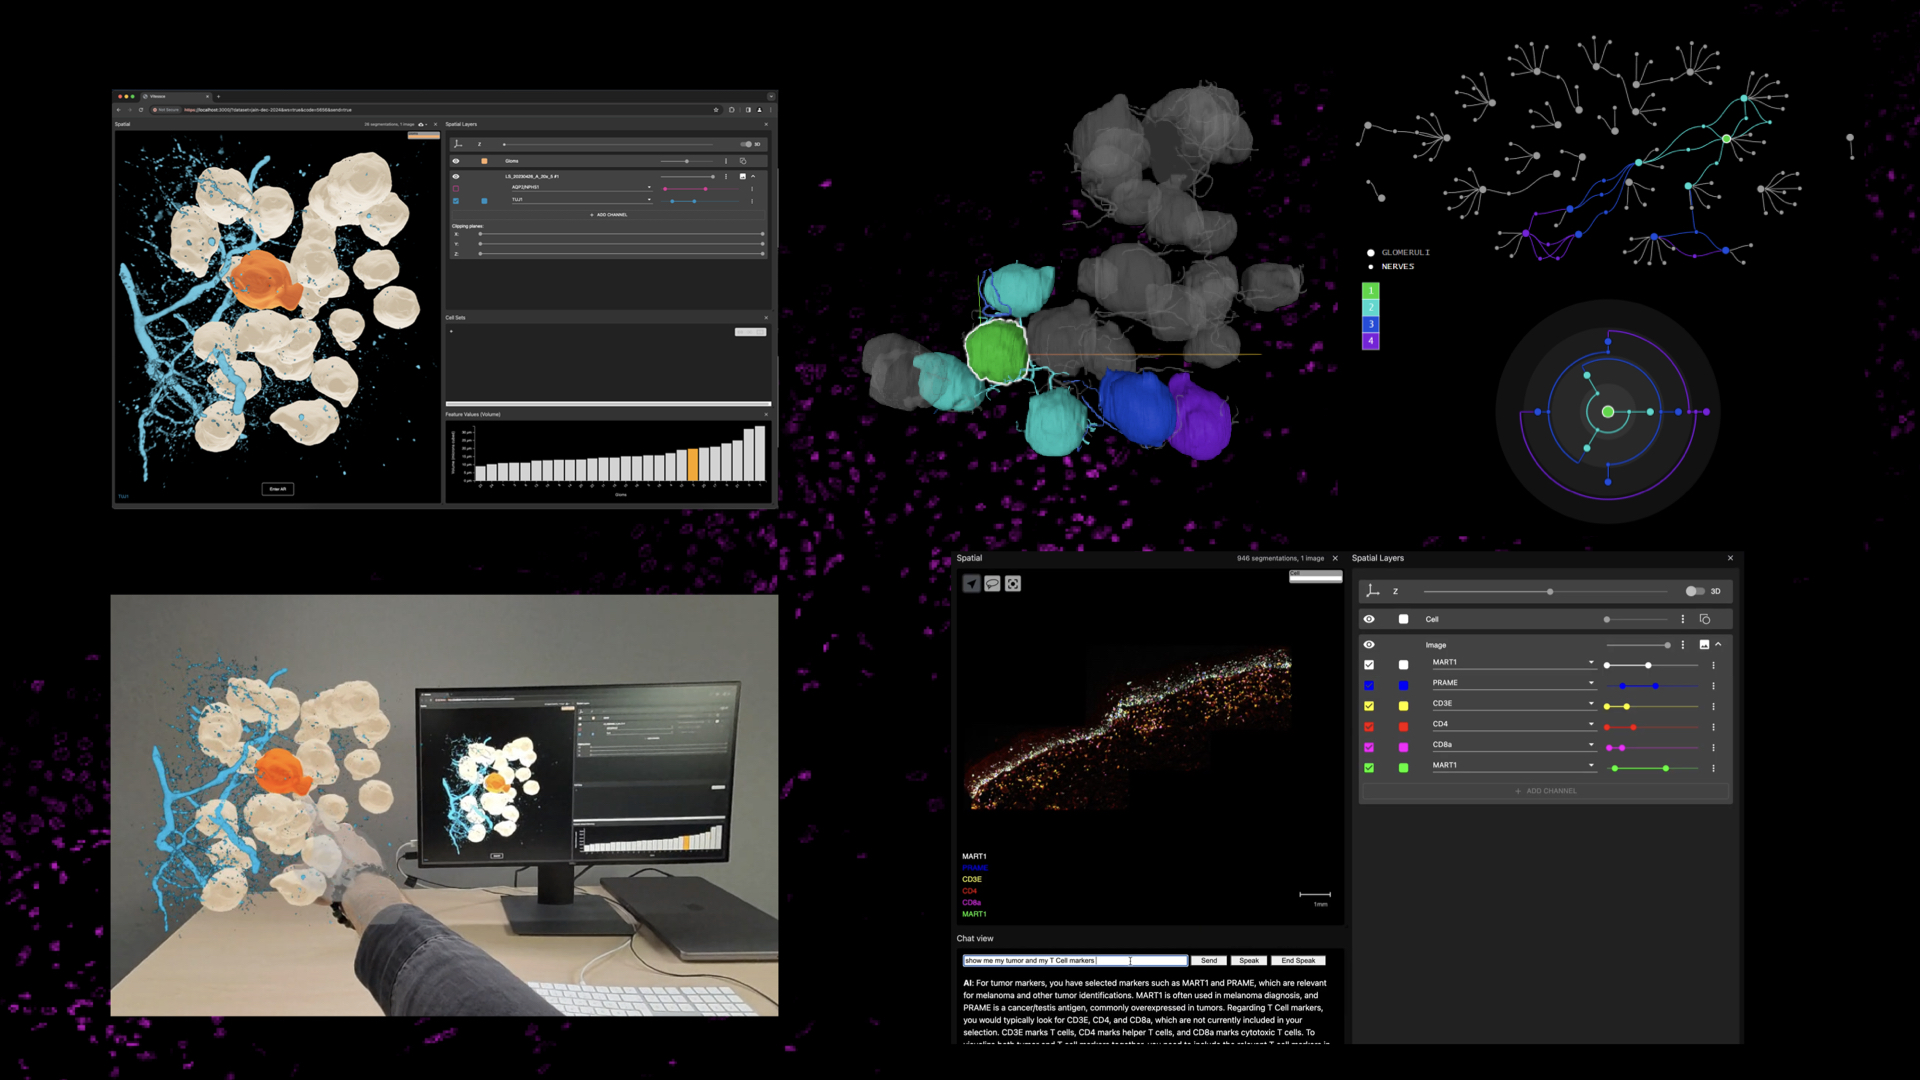
Advancements in 3D spatial biology have unlocked unprecedented opportunities to study biological systems across scales, from individual cells to functional tissue units. However, the complexity of these datasets demands innovative tools for exploration, interpretation, and hypothesis generation. Large Language Models (LLMs) offer transformative potential as interactive agents to guide and empower users—both laypersons and experts—in navigating these multidimensional datasets. By integrating LLMs with Extended Reality (XR) technologies, we can immerse users in 3D tissue maps, providing intuitive, spatially aware exploration of intricate biological structures. This approach allows users to observe, manipulate, and analyze 3D spatial data in an interactive and visually rich environment. Furthermore, combining 3D tissue maps with visual analytics can uncover patterns, network structures, and functional relationships within tissue architectures, enabling scalable analyses from the resolution of single cells to complex tissue-level networks. This synergy of LLMs, XR technologies, and advanced visual analytics redefines the boundaries of spatial biology, empowering users to bridge data complexity with actionable insights, fostering new discoveries in the life sciences.
 

Details

Category

Duration

45 +15
Host: Eduard Gröller

Speaker: Mustafa Arikan (University College London)

Abstract

This talk addresses data efficiency and robustness challenges in deep learning applications for optical coherence tomography (OCT) and bioimaging. It shows a comprehensive workflow for data management, annotation, and model training to overcome limitations posed by scarce annotated datasets, small datasets and image variability. Key contributions include an active learning strategy with human-in-the-loop, an efficient image grading framework, software tools for data preparation, and a curated multi-disease OCT dataset. These advancements aim to improving efficiency and human-AI collaboration for biomedical image analysis, benefiting healthcare and research applications.

Bio

Mustafa Arikan is a PhD candidate at UCL's Institute of Ophthalmology, combining computer science expertise with biomedical research. He holds degrees from Uni Wien and TU Wien in computer science and software engineering. He currently works as a Senior Scientist at Tecan, a Swiss-based company providing lab automation solutions. His research focuses on human-AI collaboration, deep active learning, and biomedical data analysis, bridging technology and healthcare advancements.

Details

Category

Duration

45 + 15
Host: Eduard Gröller

Speaker: Zhang, Amy (University of Bergen)

Abstract

Visual representations play an essential role in communicating complex scientific phenomena. Effective science communication often requires a team effort, where contributors work together to ensure a faithful translation of scientific evidence, understanding of communication needs, and skillful application of visualization design principles. In this talk, I reflect on two research projects that explore how collaboration—or its absence—impacts the design process of science communication products.

Bio

Amy is a scientifically-minded illustrator, designer, and visualization researcher. She contributes to projects that foster an appreciation and understanding of science as a PhD fellow within the VisGroup at the University of Bergen and previously Science Visualization Lab at the University of Toronto.

Details

Category

Duration

35 + 10
Host: Gröller, Eduard

Speaker: Garrison, Laura Ann (University of Bergen)

Abstract

Anatomy has become mainstream. Visuals of human internal structures like the heart, brain, and bones can adorn today’s posters, t-shirts, and totes, ranging from highly abstracted to hyper-accurate styles. What’s wild is that much of society can recognize and read these structures without a second thought. In this talk, I will discuss the history of medical visualization, not as a long chain of increasing complexity and sophistication, but as data-driven views of the bodies that serve as conversational artifacts developed in a particular social, technical, and cultural environment. Reflecting on these various contexts is useful, even necessary, for us to recognize our own contemporary contingencies as both readers and creators of (medical) visualizations in the present and future.

Bio

Laura Garrison is an Associate Professor of Visualization in the Institute for Informatics at the University of Bergen and affiliated with the Mohn Medical Imaging and Visualization Centre (MMIV) and the Centre for Data Science (CEDAS) in Bergen, Norway. Her research investigates the processes and assumptions designers and developers make when crafting visualizations of complex data, and their impact on audience engagement and behavior.

She received her PhD in Visualization from the University of Bergen for her work on multiscale visualization of human physiology. She was awarded the Dirk Bartz Prize for Visual Computing in Medicine in 2023 and the Karl-Heinz Höhne (MedVis) Award in 2021. Prior to her PhD, she worked as an artist and content director in medical education technology start-ups in Chicago, Silicon Valley, and New York City.

Details

Category

Duration

35 + 10
Host: Gröller, Eduard

Speaker: Vidya Prasad (Eindhoven University of Technology)

Abstract

I will briefly present an overview of my PhD research, which focuses on developing interactive explainable AI methods for the robust development of deep image-to-image translation models. My work primarily targets tasks with high-dimensional image outputs, which are significantly more complex than the classification tasks typically addressed in the literature. These methods are particularly relevant to generative and medical imaging applications.

In this talk, I will highlight my work on diffusion models, a class of deep generative models recognized for their ability to produce diverse, high-quality samples. Diffusion models iteratively transform noise into refined images with deep learning, and understanding this temporal data evolution is crucial for interpreting the model's learning process. However, the high-dimensional and complex nature of this evolution poses significant challenges. To address these challenges, we developed a novel method that provides a holistic view of this generative data evolution in diffusion models. It preserves the iterative context of the generative process by sampling the generative space with tailored prompts and extracts relevant attributes from intermediate outputs. It introduces an evolutionary embedding algorithm that clusters semantically similar elements, organizes them by iteration, and aligns an instance's elements across iterations to enable studying the evolution of data. We propose rectilinear and radial layouts for effective exploration. We show how our method was applied to Stable Diffusion, offering valuable insights into its generative process.

Note: A preprint is available on arxiv.

Bio

Vidya Prasad is a final-year PhD candidate at Eindhoven University of Technology, advised by Prof. Anna Vilanova and Dr. Nicola Pezzotti. Her research focuses on developing explainable AI and visual analytics methods to enhance the safety and reliability of deep image-to-image translation models, particularly for generative and medical applications. With a strong background in explainable AI, deep learning, medical imaging, and software development, Vidya is passionate about creating robust and impactful AI solutions. She has contributed to several papers and patents and was a visiting researcher in Prof. Hanspeter Pfister's group at Harvard. Before her PhD, Vidya worked as a deep learning researcher at Philips and as a software developer at Amazon. She holds an MSc in computer science from the National University of Singapore.

Details

Category

Duration

30 + 15
Host: Raidou, Renata

Speaker: Wang, Yu-Shuen (National Yang Ming Chiao Tung University)

Abstract

Generative adversarial networks (GANs) have seen widespread use in computer graphics and computer vision over recent years. However, they come with several drawbacks, including mode collapse, unstable training, and ambiguous convergence criteria. Moreover, conditional GANs often generate samples with limited diversity, posing significant challenges for many applications. In this talk, I will introduce normalizing flows, a unique type of generative network, discussing both their advantages and limitations. Following this, I will present various problems we have addressed using normalizing flows, such as icon colorization, basketball play synthesis, shuttle landing distribution modeling, noisy label training, and substituting datasets with normalizing flows.

Bio

Yu-Shuen Wang (王昱舜) is a professor of the Department of Computer Science at National Yang Ming Chiao Tung University. He received his PhD degree from the Visual System Laboratory, National Cheng Kung University, Tainan, Taiwan, ROC, in 2010. Currently, he lead the Computer Graphics and Visualization Lab at the Institute of Multimedia Engineering. His research interests include Computer Graphics, Computer Vision, Data Visualization, and Machine Learning. He was honored with the prestigious Wu Da-Yu Memorial Award and the NCTU EECS Outstanding Young Scholar Award in 2016.

Details

Category

Duration

45 + 15
Host: Hsiang-Yun Wu

Speaker: Michahelles, Florian (TU Wien)

Abstract

Humans have a long history of developing tools for achieving their goals. This talk will review some our own research and present potential directions of enhancing human capabilities. The talk will conclude on what humans are good at, what much machines are good at, and how both can achieve more in collaboration.

Bio

Florian Michahelles is a full professor at TU Wien for ubiquitous computing where he studies human-machine collaboration, exploring the use of machine learning and artificial intelligence in supporting human users for their tasks and activities while keeping human users in control. He has been an Associate Editors In-chief for IEEE Pervasive Computing, Associate Editor for IMWUT for more than 10 years. He is the chair of the steering committee for the IoT Conference.  His research has been covered in over 250 scientific articles with 7500+ citations and an h-index of 41. Together with his team he has received the best paper award from IoT2023, and a Ten Year Impact Award at 21st International Conference on Mobile and Ubiquitous Multimedia.

Before joining TU Wien Informatics, he was the research group head of artificial & human intelligence at Siemens in Berkeley. Before, he led the Auto-ID Labs at ETH Zurich in the field of RFID, IoT Architecture, and mobile applications. In 1999 he was an MIT Sloan Visiting Fellow and in 2010 a visiting researcher at Keio University.  He received a Ph.D. from ETH Zurich in December 2004 and a M.Sc. (Dipl-Inf.)  from the Ludwig-Maximilians University Munich in Computer Science.

Details

Category

Duration

45 + 15
Host: Gröller, Eduard

Speaker: van den Elzen, Stef (Eindhoven University of Technology )

Abstract

in this talk, I will give an overview of my own and my student's work from the visualization and visual analytics group of the Eindhoven University of Technology, The Netherlands. One focus of our group is to develop new visual representations and interaction techniques for the analysis of dynamic multivariate networks. Another focus area is visualization and interaction for explainable artificial intelligence (XAI). For both areas, a variety of examples are shown using animations and demos. Furthermore, challenges for future exploration are presented.

Bio

I am an Assistant Professor of Visual Analytics at the Eindhoven University of Technology working on Visual Analytics techniques for Networks, Events, and Explainable AI. For my PhD (cum laude) research, I developed visual analytics tools and techniques for the exploration of dynamic multivariate networks aimed at supporting both the data scientist and layman users. After and during my PhD I worked at SynerScope as VP engineering, leading the development team. I then spent time at Philips Research working on Artificial Intelligence solutions as product owner, leading a team of 15+ research scientists. My research goal is to make visual analytics easier and available to a broader audience. Artificial Intelligence (AI) is here to stay and visual analytics enables it to enhance model trust, reduce bias and increase usability and transparency.

Details

Category

Duration

45 + 15
Host: Raidou, Renata

Speaker: Troidl, Jakob (Harvard University)

Abstract

Our modern ability to acquire and generate vast amounts of data can potentially enable rapid progress in science and engineering, but we may not live up to that promise if our ability to create data outstrips our ability to make sense of that data. Human-centered visual computing tools are essential to gain insights into data by combining computational and statistical analysis with the power of the human perceptual and cognitive system and enabling data exploration through interactive visualizations. In this talk, I will present our work on visual computing in Connectomics, a new field in neuroscience that aims to apply biology and computer science to the grand challenge of determining the detailed neural circuitry of the brain. I will give an overview of the computational challenges and describe visual computing approaches we developed to discover and analyze the brain's neural network. The key to our methods is to keep the user in the loop, either for providing input to our fully automatic reconstruction methods, for validation and corrections of the reconstructed neural structures, or visual analytics of the resulting complex networks. The main challenges we face are how to analyze petabytes of image data in an efficient and scalable way, how to automatically reconstruct very large and dense neural circuits from nanoscale-resolution electron micrographs, and how to analyze the brain's neural network once we have discovered it.

Speaker Bio

Jakob Troidl is a Ph.D. candidate in computer science at Harvard University, advised by Prof. Hanspeter Pfister. In the summer, he will join the lab of Dr. Srinivas Turaga at Howard Hughes Medical Institute (HHMI), Janelia, as a visiting scientist. Jakob is broadly interested in data visualization and applied machine learning, especially with applications in computational neuroscience. His research focuses on building scalable interactive visual analysis tools and neural implicit representation learning approaches to analyze the hidden architecture of the brain. Jakob received an M.Sc. in visual computing in 2021 and a B.Sc. (with Honors) in medical informatics in 2019, both from TU Wien, Austria.

Details

Category

Duration

45 + 15
Host: Gröller, Eduard

Speaker: van der Linden, Sanne (TU Eindhoven)

Abstract

Event sequence data occurs in many domains, ranging for example from healthcare to factory data and is closely related to process mining data. Event data are discrete activities that occur over time with a event category, timestamp, possible other data attributes and a possible duration. These events are chronologically ordered in time and happen to an entity, also called a case. For example, medication events over time of a patient (case). Multiple of these sequences form a sequence collection, often sharing a similar topic, e.g., patients with the similar diseases.  There are still several challenges for analysing this data and users’ domain-knowledge is needed to get relevant insights out of the data. For example, how to deal with many sequences, long sequences, high dimensional events, or how can visualization help with process mining problems. In my PhD, we try to address several of these challenges related to scalability (long sequences or many event attributes), flexibility (how do we define a sequence), comparison (of sequences and visualization methods), conformance checking, and streaming sequences (human performance).

Bio

I am a PhD candidate from the Netherlands (Eindhoven University of Technology (TU/e)) in the visualization/visual analytics group from Anna Vilanova and am currently in Vienna for two months to collaborate with Silvia Miksch. I am in my fourth year of my PhD focused around the visualization of event sequence data. Stef van den Elzen and Anna Vilanova are my supervisors. I also studied at the TU/e. I originally have a bachelor in Industrial Design. Afterward, I did a double master in Industrial Design and Computer Science. I live in Veldhoven (village attached to Eindhoven) with my boyfriend and our two pet birds. My hobbies include traveling, (beach) volleyball, playing electrical guitar, and meeting friends.

Details

Category

Duration

45 + 15
Host: Raidou, Renata

Speaker: Wilkie, Alexander (Charles University in Prague)

Abstract: 

Predictive rendering is normally thought of as a technology stack which is mainly useful for virtual prototyping of appearance critical objects. However, such technologies also turned out to be surprisingly useful for high quality movie VFX. After giving an overview of the research portfolio of our group in Prague, I will give a brief overview of which aspects make predictive rendering appealing to the VFX industry, and outline a few technological advances of the past years.


Bio: 

Alexander Wilkie is an associate professor at Charles University in Prague, where he leads the Computer Graphics group. He also has twice been a visiting professor at the research labs of Weta Digital in New Zealand, and has made contributions to the technology stack used by them for major movie productions.

Details

Category

Duration

45 + 15
Host: Gröller, Eduard

Speaker: Weidlich, Andrea

Abstract

Efficiently simulating material appearances is a cornerstone in generating realistic imagery in content creation. While the overarching goal remains consistent across industries, the specific requirements and methodologies diverge significantly based on the intended application.

In this talk, we will discuss the divergent strategies employed by different industries in tackling the challenge of material simulation. We will discuss how modern VFX content creation pipelines are built and investigate some of their unique design choices and their implication on appearance modelling. Additionally, we will look at the transformative potential of neural network-driven approaches, offering insights into their potential to shift traditional paradigms of material representation and the novel research challenges they will bring.

Bio

Andrea Weidlich is a principal researcher and joined Nvidia in 2022 where she is part of the realtime graphics research team. Before, she worked for eight years at Weta Digital where she designed the material system attached to Weta’s proprietary physically-based renderer, Manuka, and spent several years in the automotive industry.

Her main research areas are appearance modelling and material prototyping as well as spectral image synthesis. Andrea holds a Master of Arts in Applied Media from University of Applied Arts, Vienna and a Ph.D. in Computer Science from Vienna University of Technology.

Details

Category

Duration

45 + 15
Host: Wimmer, Michael