Find the upcoming dates on this page.

Previous Talks

Speaker: Dr. Gillmann, Christina (Uni Leipzig)

Abstract: Visual Analytics (VA) is a paradigm for insight generation and automated reasoning by transforming data into hypotheses and visualization to extract new insights, feeding them back into the data. 

Many applications use this principle to provide meaningful mechanisms to assist decision-makers in achieving their goals. This process can be affected by a variety of uncertainties that can interfere with the users decision-making process. Unfortunately, there is no methodical description and handling tool to systematically include uncertainty in VA. We introduce uncertainty-aware viual analytics and its'systematic construction to solve this issue. Further, we present success stories from biomedical applications where UAVA is utilized.

CV: Christina Gillmann is a researcher with the Signal and Image Processing Group, University of Leipzig, Germany, leading her own subgroup on uncertaintyaware visual analytics (UAVA). Her research interests include UAVA, medical visualization, uncertainty analysis, and the transferability of visualization approaches into applications. She received the Ph.D. degree in computer science from the University of Kaiserslautern, Germany, in 2018.

Details

Category

Duration

45 + 15
Host: Dr. Gröller, Eduard

Speaker: Theisel, Holger (University of Magdeburg)

Objectivity is a concept from continuum mechanics, demanding invariance of a measure under continuous changes of the reference frame (coordinate system). A measure should be independent of the observer, different observers moving in different frames should come to the same conclusion about an objective measure.


While objectivity appears a rather natural condition for a useful measure, it creates problems for the analysis of flows because velocity fields are not objective. This has triggered quite some research in recent years in both computational fluid dynamics and flow visualization to come up with objective flow measures and resulting objective flow visualization techniques.


With give an overview about existing objective flow measures. In particular we focus on generic measures, i.e., approaches to transform any flow measure into an objective one. We describe recent approaches to objectivize general flow measures and resolve a dispute about the objectivity and other desired properties of our approaches.

BIO: 

Holger Theisel is professor for Visual Computing at Magdeburg University (Germany). He received his Ph.D. (1996) and habilitation (2001) degrees from the University of Rostock (Germany), and had research stays at Arizona State University (USA), ICIMAF Havana (Cuba), MPI Informatik Saarbrücken (Germany), and Bielefeld University (Germany).

His research interests focus on scientific visualization as well as on geometric design, geometry processing and information visualization and Visual Analytics. He co-authored more than 70 papers in the top journals in the field. He served the community in several ways, among them as General Chair of the IEEE VIS 2018 conference in Berlin, and VIS Executive Committee Co-Chair 2021-2023.

Details

Category

Duration

45 + 15
Host: Gröller, Eduard

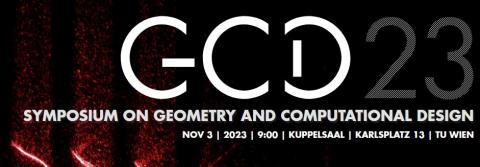
Dear colleagues,

we cordially invite you to attend our GCD Symposium 2023, featuring an 

exhibition of results from the SFB "Advanced Computational Design"!


Time:  November 3, 2023, 9:00-18:00

Place: Kuppelsaal, TU Wien


The detailed program can be found here:

https://gcd.tuwien.ac.at/?p=3300

Please forward this information to people who might be interested in the 

symposium.

We kindly ask potential participants to register for the symposium by sending 

your name, affiliation and email-address to:

gcd-registration(at)geometrie.tuwien.ac.at.

Attending the symposium will be free of charge.

We are looking forward to seeing you at the symposium!


Michael Wimmer

for the members of the

Center for Geometry and Computational Design and the

SFB Advanced Computational Design

Details

Category

Duration

9:00 - 18:00
Host: Michael Wimmer

Speaker: Dr. Jing Ren (ETH Zurich)

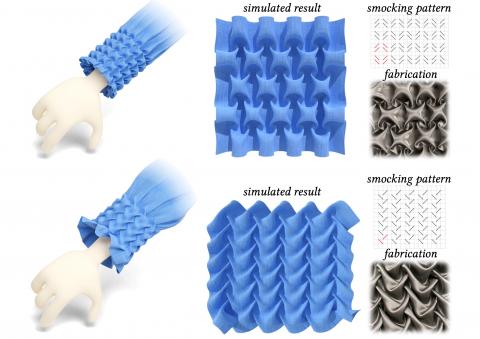
We develop an optimization-based method to model smocking, a surface embroidery technique that provides decorative geometric texturing while maintaining stretch properties of the fabric. During smocking, multiple pairs of points on the fabric are stitched together, creating non-manifold geometric features and visually pleasing textures. Designing smocking patterns is challenging, because the outcome of stitching is unpredictable: the final texture is often revealed only when the whole smocking process is completed, necessitating painstaking physical fabrication and time consuming trial-and-error experimentation. This motivates us to seek a digital smocking design method. Straightforward attempts to compute smocked fabric geometry using surface deformation or cloth simulation methods fail to produce realistic results, likely due to the intricate structure of the designs, the large number of contacts and high-curvature folds. We instead formulate smocking as a graph embedding and shape deformation problem. We extract a coarse graph representing the fabric and the stitching constraints, and then derive the graph structure of the smocked result. We solve for the 3D embedding of this graph, which in turn reliably guides the deformation of the high-resolution fabric mesh. Our optimization based method is simple, efficient, and flexible, which allows us to build an interactive system for smocking pattern exploration. To demonstrate the accuracy of our method, we compare our results to real fabrications on a large set of smocking patterns.

Details

Category

Duration

45 + 20
Host: Michael Wimmer

Speaker: Dr. Esteban Lanzarotti (University of Buenos Aires, CONICET, Buenos Aires, ARGENTINA)

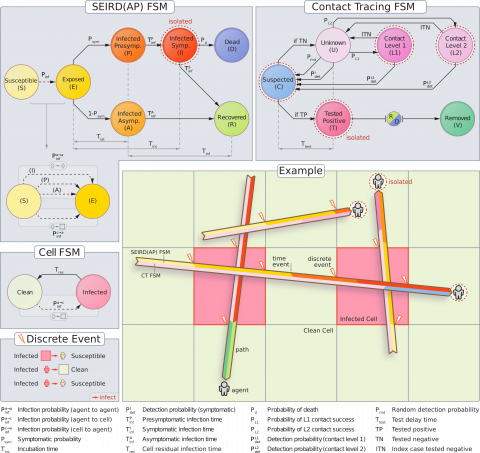
In the quest to better understand the transmission dynamics of airborne diseases and the strategies to control its impact, a wide range of simulation models have been developed. Understanding the dynamics of novel diseases with little-known characteristics and unprecedented impacts, generates a need to model multiple aspects with very dissimilar dynamics in a consistent and formal, but also flexible and quick way to study the combined interaction of these aspects. In this talk, I will present agent-based models combining kinematic movement of agents, interaction between them and their surrounding space. These models allow the analysis of different intervention strategies and their efficacy in reducing infections in a population going through an epidemic process driven mainly by airborne contagion.

Details

Category

Duration

20 + 10
Host: Edi Gröller

Speaker: Dr. Oscar Argudo (ViRVIG group of the Universitat Politècnica de Catalunya, Spain)

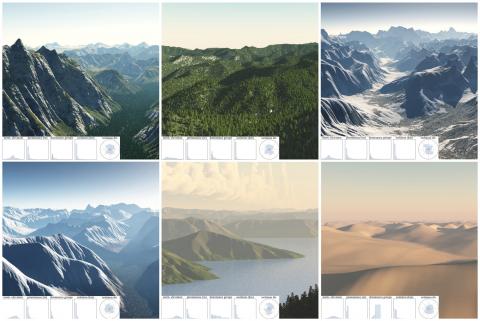
Virtual landscapes in media and games nowadays display large impressive terrains with richness of details. Therefore, the current challenge is not only to produce visually appealing scenes, but also to ensure they conform to some objective criteria for realism. For example, we could simulate the physical processes underlying natural phenomena, procedurally mimic distributions of measured properties, or learn from real data. In this talk, I will present a few works that followed these ideas to create a variety of landscapes: from deserts to glaciers, from alpine rocky peaks to gentle forested hills, and different degradation effects on natural scenes. Apart from the knowledge borrowed from Earth Sciences and other disciplines outside Computer Science, we will see the inspiration and key ideas in many of these works came from actual hikes!

Short Bio:

I am currently a Maria Zambrano research fellow at the ViRVIG group of the Universitat Politècnica de Catalunya. I obtained my PhD in Computing from UPC in 2018, under the supervision of Carlos Andújar and Antonio Chica. My thesis focused on the creation of realistic natural scenarios, leveraging machine learning techniques and real data to improve procedural and example-based modeling algorithms. After that, I was hired as a postdoctoral researcher by the CNRS in the LIRIS laboratory in Lyon, working on procedural modeling of mountainous landscapes and the simulation of natural phenomena such as dunes, glaciers and ecosystems. My current research project deals with the generation of hiking paths networks and the modeling of degradation effects caused by outdoor activities. I have published in journals such as ACM Transactions on Graphics and Computer Graphics Forum, and presented in top conferences like SIGGRAPH Asia and Eurographics.

Details

Category

Duration

45 + 30
Host: Manuela Waldner

Speaker: Prof. Daniel Weiskopf (Managing Director VIS, Co-Director VISUS Visualization Research Center (VISUS) and Institute for Visualization and Interactive Systems (VIS) University of Stuttgart)

Multidimensional data analysis is of broad interest for a wide range of applications. In this talk, I discuss visualization approaches that support the analysis of such data. I start with a brief overview of the field, a conceptual model, and a discussion of visualization strategies.
This part is accompanied by a few examples of recent advancements, with a focus on results from my own work. In the second part, I detail techniques that enrich basic visual mappings like scatterplots, parallel coordinates, or plots of dimensionality reduction by incorporating
local correlation analysis. I also discuss sampling issues in multidimensional visualization, and how we can extend it to uncertainty visualization. The talk closes with an outlook on future research directions.

Biography:
Daniel Weiskopf is a professor and one of the directors of the Visualization Research Center (VISUS) and acting director of the Institute for Visualization and Interactive Systems (VIS), both at the University of Stuttgart, Germany. He received his Dr. rer. nat. (PhD) degree in
physics from the University of Tübingen, Germany (2001), and the Habilitation degree in computer science at the University of Stuttgart, Germany (2005). His research interests include visualization, visual analytics, eye tracking, human-computer interaction, computer
graphics, augmented and virtual reality, and special and general relativity. He is spokesperson of the DFG-funded Collaborative Research Center SFB/Transregio 161 “Quantitative Methods for Visual Computing” (www.sfbtrr161.de), which covers basic research on visualization, including multidimensional visualization.

Details

Category

Duration

45 + 15
Host: Eduard Gröller

Speaker: Prof. Tobias Ritschel (University College London)

I will discuss two tracks of methods which are "advanced" in so far as they explore designs beyond classic supervised learning of a given tunable rendering pipeline. The first track makes learning itself subject to learning (meta-learning). While normal learning optimizes parameters of a tunable pipeline, meta-learning optimized the parameters of the learning. I will discuss two instances that meta-learn learning rate and initialization, and another one that meta-learns sampling.
The second track investigates the differentiability of the rendering pipeline itself. We will recall why it is challenging to differentiate through rasterization or ray-tracing. Based on this framework, we will derive methods to optimize over the space of differentiable rasterizers as well as propose a simple and effective way to differentiate the light transport equation --which has a lot of dimensions to (MC) integrate over-- by adding even more dimensions.

Biography:
Professor Tobias Ritschel has received his PhD from Saarland University (Max Planck Institute) in 2009. He was a post-doctoral researcher at Telecom ParisTech / CNRS 2009-10 and a Senior Researcher at MPI 2010-15. Tobias was appointed Senior Lecturer at University College London in 2015 where he was named Full Professor of Computer Graphics in 2019. His work has received the Eurographics Dissertation (2010) and Young Researcher Award (2014). His interests include Image Synthesis and Human Visual Perception, now frequently including applied AI.

Details

Category

Duration

45 + 15
Host: Michael Wimmer

Speaker: Prof. Jos Roerdink (Univ. Groningen)

Historically, mathematical morphology has primarily focused on the processing and analysis of two-dimensional image data. In this talk, I will survey a number of other areas where mathematical morphology has found fruitful application. I plan to address the following topics.

1. Volume processing and visualization.

Some examples are: morphological pyramids for multiresolution visualization of 3D medical data by maximum intensity projection; connected morphological operators for combined volumetric filtering and visualization; and volumetric segmentation and visualization by morphological active surface models or level sets.

2. Visual exploration of high-dimensional data.

Here there are numerous applications, such as watershed algorithms for fast reconstruction and visualization of brain networks; finding and exploring relevant subspaces in high-dimensional astronomical data; or filtering and visualization of tensor fields such as diffusion tensor imaging (DTI) data.

Details

Category

Duration

45 + 15
Host: Renata Raidou

Speaker: Dr. James Paul Ahrens (Los Alamos National Laboratory)

Visualization plays a critical role in the scientific understand of the massive streams of data from scientific simulations and experiments. Continued growth in performance and availability of large scale supercomputing resources (e.g. exascale and faster over the next decade) enables both increasing simulation resolutions and an increasing number of and breadth of simulation ensemble runs. In the modern scientific process these simulation ensembles are verified for correctness and then validated with experimental ensembles to increase our overall scientific knowledge. Effective visualization of the verification and validation (V&V) prices is a significant challenge. Additional challenges include the significant gap between supercomputing processing and data storage speeds. In this talk, I will highlight current accomplishments from the U.S. Exascale Computing Project to address these challenges include high-dimensional visual analysis, comparative visualization, in situ visualization, portable multi-threaded visualization algorithms, and automated techniques. I will present a vision of a set of needed initiatives to support the visual understanding of the complex and evolving modern scientific process.

Bio
Dr. James Ahrens is the director of the Information Science Technology Institute at Los Alamos National Laboratory. He is also the Department of Energy Exascale Computing Project (ECP) Data and Visualization lead for seven storage, data management and visualization projects that will be a key part of a vibrant exascale supercomputing application and software ecosystem. His research interests include visualization, data science and parallel computing. His research interests include visualization, data science and parallel computing. Dt. Ahrens is author of over 200 peer reviewed papers and the founder/design lead of ParaView, an open-source visualization tool designed handle extremely large data. ParaView is broadly used for scientific visualization and is in use at supercomputing and scientific centers worldwide. Dr. Ahrens received his B.S. in Computer Science for the University of Massachusetts at Amherst in 1989 and a Ph.D. in computer science from the University of Washington in 1996. Dr. Ahrens is a member of the IEEE and the IEEE Computer Society. Contact him at ahrens@lanl.gov.

Image Caption: This visualization is one member of a visualization ensemble used to study the potential effects of an asteroid impact in Earth's oceans. The study explores  the effects of varying the size of the asteroid, speed of the asteroid, and the angle of impact.

Details

Category

Duration

45 + 15
Host: Manuela Waldner

Speaker: Prof. Alice Barbora Tumpach (Univ. Lille)

Abstract:
We propose diverse canonical parameterizations of 2D-curves. For instance, the arc-length parameterization is canonical in the sense that any open curve can be parameterized by arc-length in a unique way. We consider other natural parameterizations like the parameterization proportionnal to the curvature of the curve. Both aforementionned parameterizations are very natural and correspond to a natural physical movement: the arc-length parameterization corresponds to travelling along the curve at constant speed, whereas parameterization proportionnal to curvature corresponds to a constant-speed moving frame in SO(3). Many other canonical parameterizations are considered, interpolating between arc-length parameterization and curvature-length parameterization. The main idea is that to any strictly increasing function is associated a natural parameterization of 2D-curves, which gives an optimal sampling, and which can be used to compare unparameterized curves in a efficient and pertinent way. If time permits, the link to infinite-dimensional geometry will be explained. An application to point correspondence in medical imaging will be given.

Bio:
Alice Barbora Tumpach is an Associate Professor in Mathematics since 2007 (University of Lille, France, currently on leave) and P.I. of a FWF Grant entitled "Banach Poisson-Lie groups and integrable systems" since 2021. She obtained a habilitation in mathematics in 2022, a PhD in mathematics in 2005 at Ecole Polytechnique, France, and spent two years at Ecole Polytechnique Fédérale de Lausanne as a Post-Doc. She started her studies in mathematics and physics and obtained a Bachelor in each of these specialities at ENS Paris. Her research interests include infinite dimensional geometry, Lie groups and applications to Shape Analysis. She is author and co-author of several publications in international journals (TPAMI, Communications in Mathematical  Physics, Journal of Functional Analysis, Annales de l'Institut Fourier) in the above fields. She served as reviewer for many journals, including TPAMI, Mathematische Annalen, Journal of Mathematical Physics, Journal of Mathematical Analysis and Appplication, Journal of Differential Geometry...On the other hand, she has three children and loves chilli chocolate.

Details

Category

Duration

30 + 15
Host: Eduard Gröller

Speaker: Pedro Hermosilla

Recent advances in machine learning for 3D data have revolutionized the fields of computer vision and computer graphics. These techniques have enabled researchers to train neural network architectures directly from 3D data. Among these technologies, neural networks for unstructured data or point clouds have gained a lot of attention in the past years since they are able to work with sparse 3D representations, saving large amounts of memory. However, these technologies do not come without a cost. In this presentation, I will talk about the challenges that these networks pose, how to overcome them, and how they can be used to solve different problems in the fields of computer vision, computer graphics, and bio-medicine.

Details

Category

Duration

45 + 10
Host: Eduard Gröller

Speaker: Eric Mörth

In this talk I will reflect on my time as a PhD student at the University of Bergen and will share my experiences throughout my research exchange at the Harvard University. I will talk about the ups and downs in PhD life and what helped me to pull it through and what I would have wished throughout my study time. Furthermore, I will also put my experiences into perspective and talk about how PhD life looks like at the Harvard University. What are the major differences and similarities and what could we learn from them as well as what could the Harvard University learn from Bergen.

Details

Category

Duration

45 + 15
Host: Eduard Gröller

Speaker: M. Sc. Lena Cibulski (Fraunhofer IGD & TU Darmstadt, Germany)

Abstract:

This talk provides different perspectives on using data visualization to assist and inform choices. We face many choices in our personal and professional lives. Computing has made it easy to compile large numbers of options to choose from. Identifying the best solution among such a set is called multi-attribute choice. With no objectively optimal solution present, our human judgment is needed to trade off conflicting goals.

Data visualization is a powerful tool to help us explore and make sense of available courses of action. While many interactive visualizations already live in the context of decision-making, how to design for humans who make decisions with visualized data continues to be a vibrant research area. In this talk, I will touch upon different properties of multi-attribute choices. I will also hint at the role of related disciplines like decision theory. Finally, I will lay out some open visualization challenges along with examples where our visualizations helped learn what level of performance is achievable under which conditions.

Short Bio:

Lena Cibulski is a visualization researcher at Fraunhofer IGD and a PhD candidate at Technical University of Darmstadt, Germany. She received her master’s degree in computer science in 2017 from Otto-von-Guericke University Magdeburg, where she soon found her way into visualization research. She completed her bachelor studies with a six-month stay at the VRVis Research Center in Vienna. Lena is currently a visiting researcher at JKU Linz. Her research is at the intersection between visualization and multi-attribute decision-making, with an emphasis on design studies for engineering applications. Lena conducts industrial and research projects that aim at assisting and informing decisions by using interactive visualization. She is particularly interested in multidisciplinary collaborations to encourage discussions on human factors, methodological aspects, and applications.

Details

Category

Duration

45 + 15
Host: Eduard Gröller

Speaker: Dr. Alexandra Diehl (Department of Informatics, University of Zurich)

Abstract:

The communication and early warning of high-impact weather events (HIWE), their associated risks, and recommendations to the general public, constitute a challenging and continued research topic. These challenges are due to the inherent unpredictability of the weather and the difficulties of quantifying its risk and communicating its uncertainties.

In this talk, I will present our latest research on the visual design of efficient visualization tools to communicate, analyze and quantify HIWE impact, and engage citizens in discussing severe weather events through citizens' participatory science and visualization.

Bio


I am a postdoctoral researcher in the Multimedia and Visualization group, led by Prof. Dr. Renato Pajarola at the Department of Informatics of the University of Zurich (UZH), Switzerland. I received my Dip. Eng. in Computer Engineering (2005) and my Ph.D. (2016) in Computer Science at the University of Buenos Aires, Argentina. Before my current position, I was a postdoctoral researcher at the Data Visualization and Analysis Group (DBVIS) at the University of Konstanz, Germany. I am also a lecturer, with experience teaching information visualization, visual analytics, and geographic information systems.

I currently perform research on visual analytics, guidelines and best practices for visualization in projects that range from geovisualization, multimedia analytics to environmental sciences. Along the years, I have dedicated strong efforts to the research and development of visual tools for operational weather forecasting and analysis of high-impact weather events. The full list of publications can be found here.
I am very interested in environmental science and animal protection activities, and I am a proud member of the Zurich Bird Protection / BirdLife Zurich and the Swiss Bird Protection/BirdLife Switzerland, as well as the green team of volunteers at ZÜRCHER TIERSCHUTZ.


Details

Category

Duration

45 + 10
Host: Eduard Gröller

Speaker: Prof. Renato Pajarola (Head of the Visualizion and MultiMedia Lab, Universität Zürich)

Sobol indices and other, more recent quantities of interest are of great aid in sensitivity analysis, uncertainty quantification, and model interpretation. Unfortunately, computing as well as visualizaing such indices is still challenging for high-dimensional systems. We propose the tensor train decomposition (TT) as a unified framework for surrogate modeling and sensitivity analysis of independently distributed variables, and introduce the Sobol tensor train (Sobol TT) data structure, a compressed data format that can quickly and approximately answer sophisticated queries over exponential-sized sets of Sobol indices. Furthermore, we propose a novel visualization tool that leverages this new Sobol TT representation. Our approach efficiently captures the complete global sensitivity information of high-dimensional scalar models, allows interactive aggregation and subselection operations, and we are able to obtain related Sobol indices and other related quantities at low computational cost. In our three-stage visualization, variable sets to be analyzed can be added or removed interactively. Additionally, a novel hourglass-like diagram presents the relative importance for any single variable or combination of input variables with respect to any composition of the rest of the input variables. We showcase our visualization with several example models, whereby we demonstrate the high expressive power and analytical capability made possible with the proposed Sobol TT method.

Details

Category

Duration

45 + 15
Host: Eduard Gröller

Speaker: Prof. Takayuki Itoh (Ochanomizu University, Japan)

Visualization of densely connected graphs has been a long-term research problem, and many studies have applied graph hierarchization schemes.
In this talk, as well as the speaker's own hierarchical graph visualization methods, applications to gene networks and human networks will be presented.  Also, this talk will introduce the evaluation criteria that the speaker have proposed for the visualization results of hierarchical graphs, and discuss new appoaches in hierarchical graph visualization using these evaluation criteria.

Short Bio:
Takayuki Itoh is a full professor of Ochanomizu University, Japan. He received his Ph.D. degree from Waseda University in 1997. He was a researcher of IBM Research, Tokyo Research Laboratory from 1992 to 2005.  He moved to Ochanomizu University as an associate professor in 2005 and then has been a full professor since 2011.    He is mainly working on information visualization, especially graph, hierarchical, and multidimensional data visualization.  He is
the general chair of IEEE Pacific Visualization 2018, Graph Drawing 2022, and many other international conferences.   He will be one of the short paper chairs of IEEE VIS 2023.

Details

Category

Duration

45+15
Host: Renata Raidou

Speaker: Assoc.Prof. Dr. Marianna Zichar (University of Debrecen, Department of Data Science and Visualization)

The purpose of creating 3D models can be very different, the tools we can use are diverse, and their applications are related to many fields.
One of the emerging technologies, namely 3D printing, needs 3D models as well.
Characteristics of these models depend on the manufacturing method as well as on their usage. The talk presents the fields where I work with 3D printable models (research, education, different projects)and tries to emphasize the benefits of 3D printing.
 
Short Bio:
Marianna Zichar gained her Ph.D. in Mathematics and Computer Science at the University of Debrecen, where she works as an associate professor.
Her original field of interest is GIS (geographic information systems), where she focuses on geovisualization.
Some years ago, she started to deal with 3D printing and modeling after the faculty received a 3D printer.
Together with some colleagues, she has designed a course on 3D printing and modeling, and she holds this course for bachelor students regularly. She takes every opportunity to collaborate with researchers from other disciplines (such as pharmacy, engineering) and also tends to introduce this innovative field for students in the frame of different projects and workshops.
 

Details

Category

Duration

45+15
Host: Manuela Waldner

Speaker: Dr. María Luján Ganuza (Universidad Nacional del Sur, Bahía Blanca, Argentina), Dr. Matías Selzer (Universidad Nacional del Sur, Bahía Blanca, Argentina)

Dr. Matías Selzer and Dr. María Luján Ganuza are part of the VyGLab (Research Laboratory in Visualization and Computer Graphics), at the DCIC (Department of Computer Science and Engineering) at the Universidad Nacional del Sur, Bahía Blanca, Argentina.

In this talk, they will introduce their recent research topics, regarding virtual and augmented reality and multidimensional data visualization.

Details

Category

Duration

20 + 20
Host: Eduard Gröller

Speaker: Prof. Alexander Lex (Scientific Computing and Imaging Institute and the School of Computing at the University of Utah)

Traditional empirical user studies tend to focus on testing aspects of visualizations or perceptual effects that can be fully controlled. Evaluating or comparing complex interactive visualization techniques, in contrast, is much more difficult, as complexity increases confounders. This challenge is aggravated when using crowdsourcing for evaluation, as crowd participants tend to be novices with limited motivation for excelling at a task. In this talk I will introduce methods to run and analyze such studies for complex visualization techniques, including procedural suggestions for crowdsourced studies, design of stimuli for testing, instrumentation of stimuli, and analysis of user behavior based on the data collected. 

Bio

I am an Associate Professor of Computer Science at the Scientific Computing and Imaging Institute and the School of Computing at the University of Utah. I direct the Visualization Design Lab where we develop visualization methods and systems to help solve today’s scientific problems.

Before joining the University of Utah, I was a lecturer and post-doctoral visualization researcher at Harvard University. I received my PhD, master’s, and undergraduate degrees from Graz University of Technology. In 2011 I was a visiting researcher at Harvard Medical School.

I am the recipient of an NSF CAREER award and multiple best paper awards or best paper honorable mentions at IEEE VIS, ACM CHI, and other conferences. I also received a best dissertation award from my alma mater. 

I co-founded Datavisyn (http://datavisyn.io), a startup company developing visual analytics solutions for the pharmaceutical industry, where I’m currently spending my sabbatical. 

http://alexander-lex.net

Video

Details

Category

Duration

45 + 30
Host: Manuela Waldner

Speaker: Prof. G. Elisabeta Marai (University of Illinois Chicago )

Abstract:

Data visualization research often seeks to help solve real world problems across application domains, from biomedicine to engineering.
There is considerable merit in such endeavors, which often help advance knowledge in these application domains. Beyond these contributions, as we work alongside domain experts, we also have a unique opportunity to observe qualitatively and analyze how these clients interact with the data through our tools and paradigms. Thus, we have a rare opportunity to better ground data visualization theory on these observations. In this talk, I will examine how working with real world data and problems can point out specific gaps in our theoretical knowledge, can challenge underlying assumptions in the data visualization field, and can lead to new insights and theoretical guidelines. I will focus on several theoretical contributions grounded in this experience, from activity-centered design to visual scaffolding, the details-first paradigm, and visual explainability in artificial intelligence. Last, I will reflect on the lessons learned through this experience, with particular emphasis on the barriers our field poses to new theoretical contributions.

Bio:

Liz Marai is an associate professor of Computer Science at the University of Illinois at Chicago. Her research interests go from visual-system related problems that can be robustly solved through automation, to problems that require human experts in the computational loop, and the principles behind this work. Marai's research has been recognized by multiple prestigious awards, including: a Test of Time award from the International Society for Computational Biology, and several Outstanding Paper awards, along with her students; an NSF CAREER Award and multiple NSF awards; and several multi-site NIH R01 awards as a lead investigator. She has co-authored scientific open-source software adopted by thousands of users, and she is a patent co-author, whose algorithms have been embedded in a medical device.

Details

Category

Duration

45 + 30

Speaker: Eric Mörth (Visualization Group, University of Bergen )

Multiparametric imaging in cancer has been shown to be useful for tumor detection. Furthermore, radiomic tumor profiling enables a deeper analysis of tumor phenotypes and enables analysis of a possible link to aggressiveness of the tumor. Analyzing complex imaging data in combination with clinical data is not trivial. We enable clinical experts to gather new insights of their multiparametric imaging data as well as cohort data. We include more than 7 modalities in a single view as well as cohort data of more than 100 endometrial cancer patients, including manually performed tumor segmentations. The goal of our contributions is to enable medical experts to obtain deeper understanding of different tumor types to define individual treatment for each patient.

Supporting the communication in science as well as between doctors and patients is another challenging task and one of our goals. In our latest contribution we propose a novel approach for authoring, editing, and presenting data-driven scientific narratives using scrollytelling. Our method flexibly integrates common sources such as images, text, and video, but also supports more specialized visualization techniques such as interactive maps or scalar field visualizations.

In this talk, I will present our efforts to scale up medical visualization supporting multi-modal, multi-patient and multi-audience approaches for healthcare data analysis and communication.


Speaker: Dr. Alexandra Diehl (Department of Informatics, University of Zurich)

According to the United Nations Office for Disaster Risk Reduction (UNDRR), the indirect economic losses caused by climate-related disasters increased by over 150 % during 1998–2017 compared to the period 1978– 1997 [1]. Among the most prominent high-impact weather events are flooding, storms, and heatwaves. Scientists need to improve the accuracy and communication of weather forecasting to reduce or even avoid the damage caused by these kinds of weather hazards.

 Citizens continuously generate an enormous amount of digital content of diverse kinds, such as blog posts, tweets, and photos and videos. People tend to proactively participate in digital media and communicate this kind of severe weather events in internet channels such as social media, news feeds, and citizen science projects, which represents a huge opportunity to improve current weather forecasting. To engage users in weather forecasting, meteorologists need effective visual communication tools to process the information and make it to citizens.

 In this talk, I will present some initial efforts in the visual analysis of citizen-generated data to extract useful information associated with severe weather events and identify expert users among the social networks and a perceptually-based visual design of a mobile application for citizen science on high-impact weather events.

 [1] P.Wallemacq and R. House. UNISDR and CRED report. economic losses, poverty, and disasters 1998–2017. Brussels: Centre for research on the epidemiology of disasters (CRED), 31, 2018.

Details

Category

Duration

30 + 15

Speaker: Prof. Dr. Wolfgang Heidrich (Director, Visual Computing Center, King Abdullah University of Science and Technology)

Details

Category

Duration

45 + 30

Speaker: Carmine Elvezio (Columbia University)

Augmented Reality (AR) and Virtual Reality (VR), collectively known as eXtended Reality (XR) experiences are built on rich, complex real-time interactive systems (RISs) that require the integration of numerous components supporting everything from rendering of virtual content to tracking of objects and people in the real world. Game engines such as Unity and Unreal currently provide a significantly easier pipeline than in the past to integrate different subsystems of XR applications. But there are a number of development questions that arise when considering how interaction, visualization, rendering, and application logic should interact, as developers are often left to create the “logical glue” on their own, leading to software components with low reusability. In this talk, I present a new software design pattern, the Relay & Responder (R&R) pattern, that attempts to address the concerns found with many traditional object-oriented approaches in XR systems. The R&R pattern simplifies the design of these systems by separating logical components from the communication infrastructure that connects them, while minimizing coupling and facilitating the creation of logical hierarchies that can improve XR application design and module reuse. 

Additionally, I explore how this pattern can, across a number of different research development efforts, aid in the creation of powerful and rich XR RISs. I first present related work in XR system design and introduce the R&R pattern. Then I discuss how XR development can be eased by utilizing modular building blocks and present the Mercury Messaging framework (https://github.com/ColumbiaCGUI/MercuryMessaging), which implements the R&R pattern. Next I delve into three new XR systems that explore complex XR RIS designs (including user-study-management modules) using the pattern and framework. I then address the creation of multi-user, networked XR RISs using R&R and Mercury. Finally I end with a discussion on additional considerations, advantages, and limitations of the pattern and framework, in addition to prospective future work that will help improve both.

Dr. Carmine Elvezio recently received his PhD in CS from Columbia University, studying AR/VR/MR and 3D graphics, and interaction and visualization techniques in the Computer Graphics and User Interfaces Lab, advised by Prof. Steven Feiner. He develops 3D systems across several domains including medicine, remote maintenance, space, music, and rehabilitation, working with many technologies including Microsoft HoloLens, Oculus Rift, Unity, Unreal, and OpenGL. He has participated in projects sponsored by NSF,  Google, Verizon, Canon, and NASA, amongst others. He has also contributed to a number of open-source frameworks, including MercuryMessaging (https://github.com/ColumbiaCGUI/MercuryMessaging) and GoblinXNA.

Carmine managed the CGUI Lab at Columbia with Prof. Feiner from 2013 until 2021, where he advised over 150 independent research projects, assisted in teaching courses on 3D user interfaces, AR, and VR, and participated in many multi-disciplinary university initiatives.