Speaker: Prof. Dr. Alexandra Diehl
Abstract
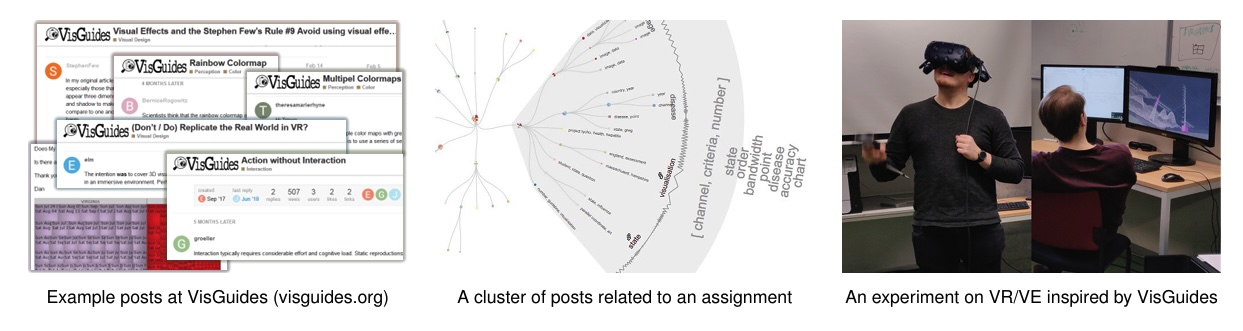
Visualization guidelines play a central role in shaping both practical visualization design and the theoretical foundations of our field. Yet despite their ubiquity, many guidelines remain imprecise, weakly contextualized, or insufficiently scrutinized. In this talk, I will reflect on several years of research dedicated to studying, formalizing, and empirically grounding visualization guidelines through the lens of Grounded Theory (GT). Drawing on discourses from VisGuides, an online forum dedicated to visualization guidelines, we developed a multi‑layered research program that combines traditional GT practices—such as open and axial coding, constant comparison, and negative case analysis—with computer‑assisted text analysis, visualization techniques, and controlled empirical studies. This work has enabled us to characterize how guidelines are discussed, interpreted, and applied in practice; to uncover implicit assumptions and contextual dependencies; and to identify opportunities for refining existing guidelines or formulating new ones. By integrating GT with visualization methods and empirical validation, we demonstrate how a data‑driven, theory‑building approach can strengthen the conceptual foundations of visualization and support the long‑term curation and evolution of visualization guidelines.
Bio
Alexandra Diehl is an Associate Professor at the University of Southern Denmark, where she teaches data visualization and conducts research at the intersection of two complementary areas: the study of visualization best practices and guidelines, and the application of visual analytics to weather and environmental science. Her work brings together qualitative and quantitative methods to understand how visualization guidelines are formulated, interpreted, and validated, and how to apply them in the context of visual analytics to support domain experts in high‑stakes decision‑making.
Before joining SDU, Dr. Diehl was part of the Visualization and Multimedia Analysis Lab at the University of Zurich and the Data Analysis and Visualization Group at the University of Konstanz.
Dr. Diehl holds a Ph.D. in Computer Science from the University of Buenos Aires. Her research spans visualization guidelines, visual analytics, and environmental visualization, with a strong emphasis on interdisciplinary collaboration and methodological rigor. More information is available at https://www.alexandra-diehl.science/.