![[image]](/courses/Visualisierung/VOLogoS-1998.gif)
| LU Visualisierung - Resultate
|
|
**********************************************************************
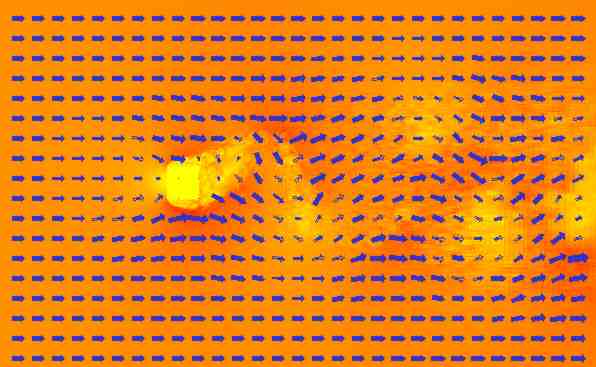
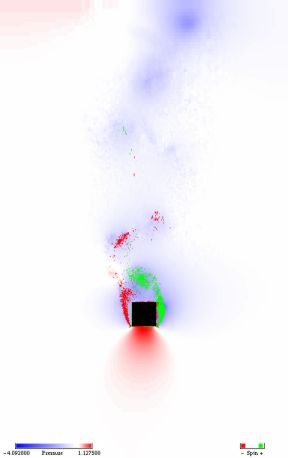
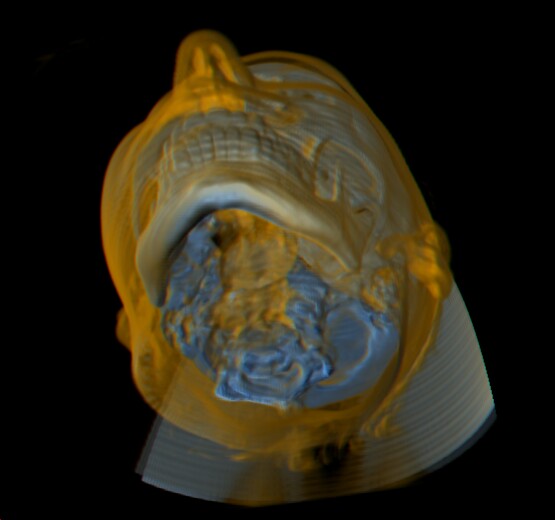
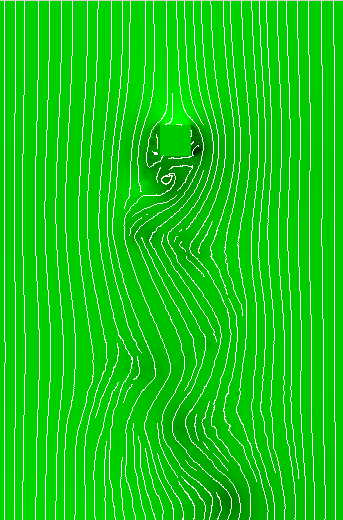
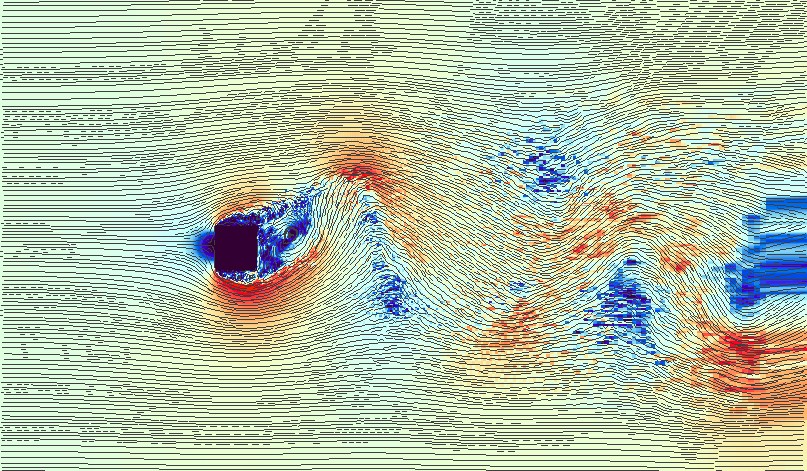
The data used for the flow visualization assignment was generated by
R.W.C.P. Verstappen & A.E.P. Veldman of the university of Groningen
(the Netherlands)
The technique used to generate the data is described in:
R.W.C.P. Verstappen & A.E.P. Veldman, 1998: Spectro-consistent
discretization of Navier-Stokes: a Challenge to RANS and LES,
Journal of Engineering Mathematics, Vol. 34, pp. 163-179
**********************************************************************
 |
Christoph Berger |
 |
 |
Armin Kanitsar |
 |
 |
Balazs Lichtl |
 |
 |
Matej Mlejnek |
 |
Christian Schwarzinger |
 |