Developed for the course Visualization at the Institute of Computer Graphics in the
winter term 2000. This Course was held by
The program takes a .dat and .grd file as an input. The .grd file contains informations about the size and geometry of the data file. Within the .dat file gradient, pressure and spin information is stored. To use this program you need both of them. They can be found here. For more details also refer to the README_BSP2.txt file zipped within. For installation create a new directory unzip blockData.zip and flowViz.zip there. The program has to be run as follows:
FlowViz c_block stretch-factor
Where stretch-factor stands for a number between 10 and 60 indicating the enlargement of the dataset. The calculated image can be stored as a .bmp file. It is also possible to render an animation witch is stored as a sequence of .bmp files. These files can be post processed in order to generate an animation.
For legal purpose the following text has to be mentioned:
**********************************************************************
Slice
of Direct Numerical Simulation (DNS) of a flow around a block
Use under
the condition that the people who generated the data
are properly
mentioned:
The data is generated by R.W.C.P. Verstappen &
A.E.P.
Veldman of the university of Groningen (the Netherlands)
The technique used
to generate the data is described in:
R.W.C.P. Verstappen & A.E.P.
Veldman, 1998: Spectro-consistent
discretization of Navier-Stokes: a
Challenge to RANS and LES,
Journal of Engineering Mathematics, Vol. 34, pp.
163-179
**********************************************************************
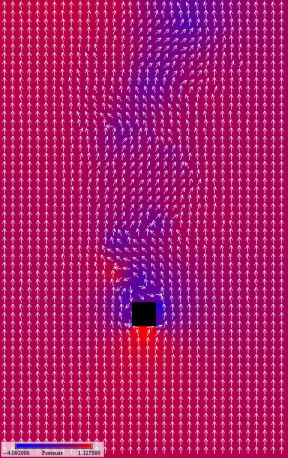
An arrow plot technique is used to visualize the flow. The arrows can be viewed at equal length or depending on the flow velocity. The impression of what's going on can be increased by visualizing the pressure and the spin in the background of the image. It is possible to change the coloring of the pressure. The program takes any .bmp file and uses the first 256 color entries as color table from lowest value to the highest. This feature makes the program extremely flexible because very complex color tables can be generated using any image editing software.
The second technique visualizes the dataset by using so called stream lines. There are several ways how to generate streamlines. Two of them are implemented in the software: Euler and Runge-Kutta integration. The two procedures mainly differs in the precision of the result. A very useful feature is to automatic create evenly spaced streamlines. This provides a very good impression of the flow around an object. More details to this technique can be found at http://www-lil.univ-littoral.fr/~lefer/papers/Springer97.abstract.html.
An animation can be generated by simulating particles inside the flow. This results in a very intuitive kind of visualization. In this case so called path lines are used.
| Processor | Pentium II 350 |
| Memory | 64 MB |
| Operating System | NT 4.0 SR 3, W2000, W98, WinME |
| Graphics adapter | OpenGL capabilities required. |
| Additional Software | GLUT Libraries |
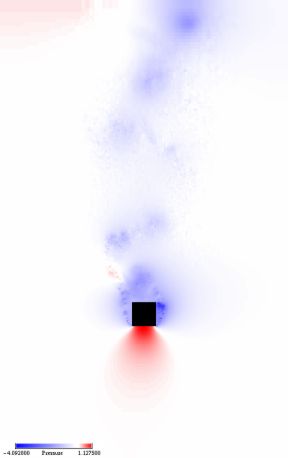
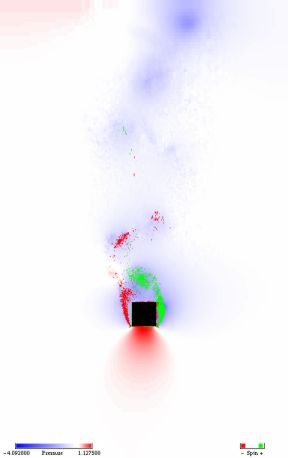
Left: The blue areas of the image represents low pressure; the red ones high pressure. Right: The red colored parts represents areas rotating clockwise the green ones are rotating counterclockwise.
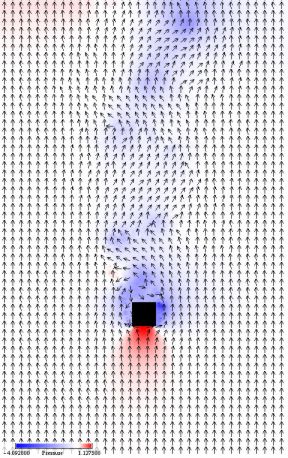
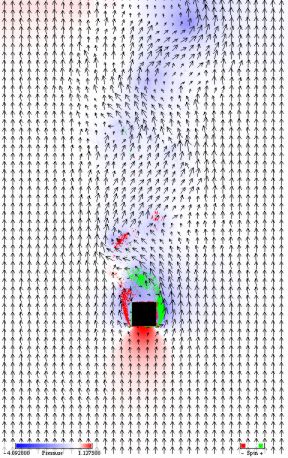
Left: Arrow plot with equal length arrows. Right: The length of each arrow represents the flow velocity.
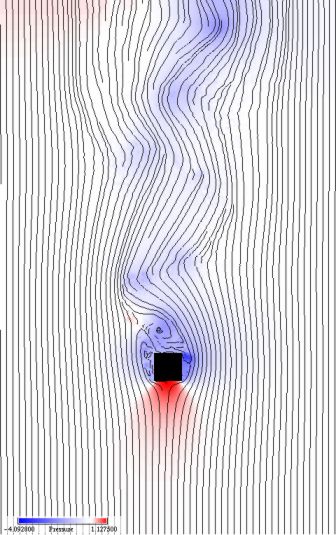
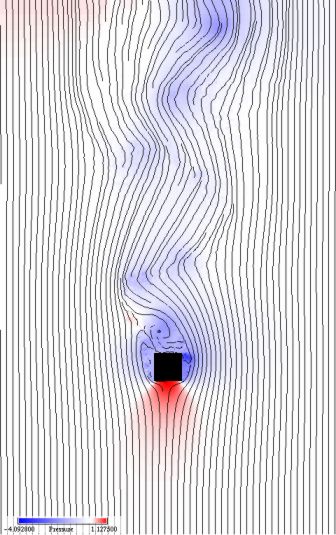
Left: Euler integration. Right: Runge-Kutta integration. Both were calculated with a minimum distance of 8.0 at line start and 2.0 as stop condition.
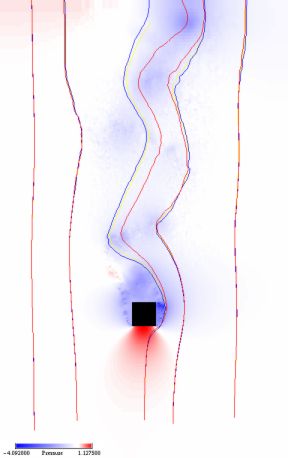
Left: Using a different coloring for the pressure value. Right: Comparison between the different integration methods. The Euler integration is colored blue. Runge-Kutta integration is colored red. The yellow line is regarded as correct path because of a step length of 0.1 pixels. The other two lines were drawn using a step length of 5.
This is the animation.
If you click on the picture you will be directed to the download area.
It's really worth a look!
More videos are available on my homepage.
The dataset