Organization
The lectures will be recorded and uploaded to an associated TUWEL course. Information on the exercises is available in TUWEL. Registration to the course is done through TISS.
Schedule
| Thursday 10.10.2019 |
1100-1300 SEM186 |
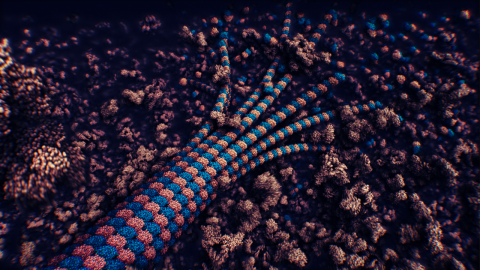
Introduction to Real-Time Visualization Course Real-Time Molecular Visualization Peter Mindek |
| Thursday 31.10.2019 |
1100-1300 SEM186 |
Real-Time Visual Analytics Manuela Waldner |
| Thursday 7.11.2019 |
1100-1300 SEM186 |
Real-Time Ultrasound Processing and Rendering Renata Raidou |
| Thursday 14.11.2019 |
1100-1300 SEM186 |
High-Performance Computing and Visualization Hsiang-Yun Wu |
| Thursday 21.11.2019 |
1100-1300 SEM186 |
GPGPU for Real-Time Visualization Nicolas Grossmann |
| Thursday 28.11.2019 |
1100-1300 SEM186 |
Real-Time Volume Rendering and Advanced Illumination Haichao Miao |
| Thursday 5.12.2019 |
1100-1300 SEM186 |
Real-Time Fluid Simulation and Visualization David Kouril |
| Thursday 12.12.2019 |
1100-1300 SEM186 |
Real-Time Large Graph Visualization Peter Mindek |
Grading
There is a nominal amount of 100 points. During the written exams maximum of 50 points can be obtained. The exams are written and take place on the next lecture after the frontal lecture is finished and the overall time is 15 minutes per exam. The lab has nominal 50 points plus additional 10 bonus points. The grading scheme is as follows: -49 = 5 … 50-52 = 4 … 63-74 = 3 … 75-87 = 2 … 88- = 1.
Related courses
186.827, VU Visualisierung 1; WS; Eduard Gröller & Tobias Klein
186.833, VU Visualisierung 2; WS; Eduard Gröller & al.
186.105, VU Visualisierung medizinischer Daten 1; SS; Renata Raidou
186.138, VU Visualisierung medizinischer Daten 2; WS; Renata Raidou
188.305, VO Informationsvisualisierung; SS; Kresimir Matkovic
186.143, UE Informationsvisualisierung; SS; Kresimir Matkovic & al.
188.162, VU Informationsvisualisierung; WS; Silvia Miksch
186.166, VU Entwurf und Programmierung einer Rendering-Engine; WS; Harald Steinlechner
186.046, SE aus Visualisierung; Eduard Gröller
186.829, PR Bachelorarbeit für Informatik und Wirtschaftsinformatik; Eduard Gröller et al.
186.834, PR Praktikum aus Visual Computing; Eduard Gröller et al.
Central European Seminar on Computer Graphics; Michael Wimmer et al.
