

Narumi Kuroko, Hayato Ohya, Takayuki Itoh, Nicolas Grossmann, Hsiang-Yun Wu
Visualization of Correlations between Places of Music Listening and Acoustic Features
In Proceedings of the 24th International Conference on Information Visualisation (iV2020), pages 1-6. September 2020.
[image] [ paper]
Information
- Publication Type: Conference Paper
- Workgroup(s)/Project(s):
- Date: September 2020
- Lecturer: Narumi Kuroko
- Event: The 24th International Conference on Information Visualisation (iV2020)
- Call for Papers: Call for Paper
- Booktitle: Proceedings of the 24th International Conference on Information Visualisation (iV2020)
- Pages: 1 – 6
Abstract
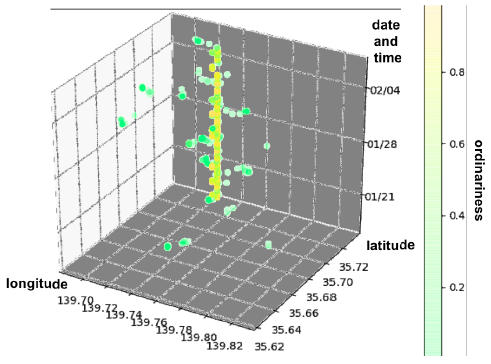
Users often choose songs with respect to special situations and environments. We designed and developed a music recommendation method inspired by this fact. This method selects songs based on the distribution of acoustic features of the songs listened by a user at particular places that have higher ordinariness for the user. It is important to verify the relationship between the places where the songs are listened to and the acoustic features in this. Hence, we conducted the visualization to explore potential correlations between geographic locations and the music features of single users. In this paper, we designed an interactive visualization tool methods and results for the analysis of the relationship between the places and the acoustic features while listening to the songs.Additional Files and Images

Weblinks
BibTeX
@inproceedings{Kuroko-2020-iV,
  title =      "Visualization of Correlations between Places of Music
               Listening and Acoustic Features ",
  author =     "Narumi Kuroko and Hayato Ohya and Takayuki Itoh and Nicolas
               Grossmann and Hsiang-Yun Wu",
  year =       "2020",
  abstract =   "Users often choose songs with respect to special situations
               and environments. We designed and developed a music
               recommendation method inspired by this fact. This method
               selects songs based on the distribution of acoustic features
               of the songs listened by a user at particular places that
               have higher ordinariness for the user. It is important to
               verify the relationship between the places where the songs
               are listened to and the acoustic features in this. Hence, we
               conducted the visualization to explore potential
               correlations between geographic locations and the music
               features of single users. In this paper, we designed an
               interactive visualization tool methods and results for the
               analysis of the relationship between the places and the
               acoustic features while listening to the songs.",
  month =      sep,
  event =      "The 24th International Conference on Information
               Visualisation (iV2020)",
  booktitle =  "Proceedings of the 24th International Conference on
               Information Visualisation (iV2020)",
  pages =      "1--6",
  URL =        "https://www.cg.tuwien.ac.at/research/publications/2020/Kuroko-2020-iV/",
}