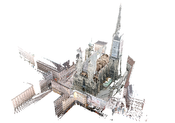
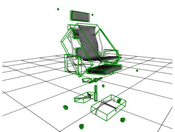
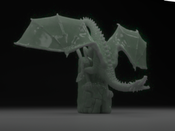
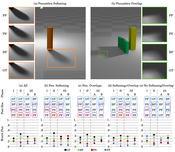
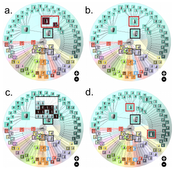
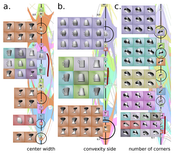
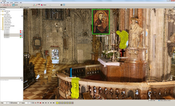
Show images of current Projects | Years: 2013 - 2014 - 2015.
X-Mas Cards
Every year a christmas card showing aspects of our research projects is produced and sent out.Visual Computing: Illustrative Visualization
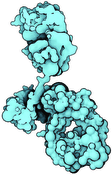
The central focus of our research is to understand visual abstraction. Understanding means 1. to identify meaningful visual abstractions, 2. to assess their effectiveness for human perception and cognition and 3. to formalize them to be executable on a computational machinery. The outcome of the investigation is useful for designing visualizations for a given scenario or need, whose effectiveness can be quantified and thus the most understandable visualization design can be effortlessly determined. The science of visualization has already gained some understanding of structural visual abstraction. When for example illustrators, artists, and visualization designers convey certain structure, or visually express how things look, we can often provide a scientifically-founded argument whether and why is their expression effective for human cognitive processing. What has not been given sufficient scientific attention to, is advancing the understanding of procedural visual abstraction, in other words investigating visual means that convey what things do or how things work. This missing piece of knowledge would be very useful for visual depiction of processes and dynamics that are omnipresent in science, technology, but also in our everyday lives. The upcoming project will therefore investigate theoretical foundations for visualization of processes. Physiological processes that describe the complex machinery of biological life will be picked as a target scenario. The reason for this choice is two-fold. Firstly, these processes are immensely complex, are carried-out on various spatial and temporal levels simultaneously, and can be sufficiently understood only if all scales are considered. Secondly, physiological processes have been modeled as a result of intensive research in biology, systems biology, and biochemistry and are available in a form of digital data. The goal will be to visually communicate how physiological processes participate on life by considering the limitations of human perceptual and cognitive capabilities. By solving individual visualization problems of this challenging target scenario, the research will provide first pieces of understanding of procedural visual abstractions that are generally applicable, beyond the chosen target domain. Prototype implementation of the developed technology is available at the GitHub repository: https://github.com/illvisation/
Prototype implementation of the developed technology is available at the GitHub repository:
https://github.com/illvisation/
cellVIEW
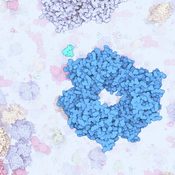
cellVIEW is a new tool that provides fast rendering of very large biological macromolecular scenes and is inspired by state-of-the-art computer graphics techniques. Click here for additional information.
Invited Talks
18.11.2016: Arthur J. Olson, Envisioning the Visible Molecular Cell
17.10.2016: Kwan-Liu Ma, Emerging Topics for Visualization Research: Part1, Part2
07.10.2016: Marc Streit, From Visual Exploration to Storytelling and Back Again
04.12.2015: Jan Palacek, Visual Analysis of Protein Complexes: From Protein Interaction to Cellular Processes
19.04.2013: Jan Koenderink, Shape in Visual Awareness
Data-Driven Procedural Modeling of Interiors
The project develops new procedural modeling methods for interior scenes.Harvest4D - Harvesting Dynamic 3D Worlds from Commodity Sensor Clouds
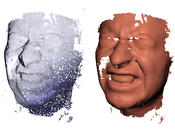
Harvest4D investigates the whole acquisition, modeling and rendering pipeline for incidental data capture.Modern Functional Analysis in Computer Graphics
The projects develops new mathematical foundations for global-illumination algorithms.Photo-Guide: Image-Based City Exploration
The core idea of the project is the enhancement of current state-of-the art navigation systems by visual information obtained from geo-referenced photographs. The aim is to establish a suite of tools together with algorithmic foundations that will be essential for any large scale image-based guidance project.ViMaL: A Visualization Mapping Language
Visualization is the discipline dealing with the depiction of data. The assignment of visual abstractions to data abstractions is referred to as the visualization mapping.Expressive visualization mappings proofed in many cases to be more effective than the examination of raw data (i.e., large tables of numbers). Although visualization mapping is a crucial step in the visualization pipeline surprisingly few general approaches exist.
We propose to develop the Visualization Mapping Language (ViMaL) that is capable of describing expressive visualization mappings and provides user interfaces suitable for non-experts in visualization.
ViMaL will be a language that is used to specify visualization pipelines. We will provide language concepts for the specification of data abstraction processes, visual concretization processes and the required visualization mapping. With this approach the semantics of a specific domain are modeled by the domain experts while the semantics of the visualization domain are modeled by the visualization expert. The visualization mapping is described using domain semantics as well as visualization semantics. Unlike other general purpose visualization systems, ViMaL systems explicitly use the semantics of the visualization mapping process. It incorporates information and knowledge assisted methods in the visualization mapping pipeline.
In the scope of this project we will define a novel Visualization Mapping Language and implement a toolbox that aids researchers from other areas to integrate the ViMaL concepts into their systems. The toolbox will provide basic ViMaL document setup and parsing as well as components for each step in the visualization pipeline. We will make use of fuzzy logic in our components for the abstraction of data, for the visual concretization, and for the visualization mapping.
We believe that the formalization of the visualization pipeline that is achieved with the visualization mapping language will enable many researchers from other domains to benefit from existing visualization methods. Further, the introduction of domain and visualization semantics for the specification of visualization mappings enables meta-visualization approaches that provide insight into the visualization process itself. Laypersons will benefit from such meta-visualization systems that are able to illustrate the involved components.

