VisLink: Revealing Relationships Amongst Visualizations
Wolfgang Knecht
| start |
|---|
| GUI |
| dataset |
| visualization |
| linking |
| navigation |
| documentation |
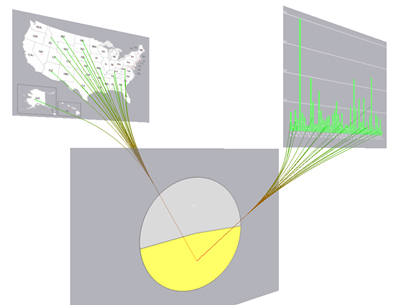
The edges are represented by the usage of splines. Color of edges illustrates start and end point. Start point is red and the end point is described by green. The ordering of splines takes not the z-value into account instead of this the two neighboring planes presents their relations.
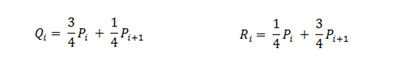
Chaikins provides a nice algorithm to create fast and easy nice splines. Through the fact of following estimation the bundling is done automatically. The middle point is given by the sum of each x and y value of every different point. After that normalization is done to get a correct reference point. Because of this third point the splines are calculated by the help of Chaikins' algorithm. Two points are taken and between these new points Q and R are estimated in the following way:
In the next step only the new points are used for calculating again more points. After several steps a smooth curve is created like in the next figure illustrated.
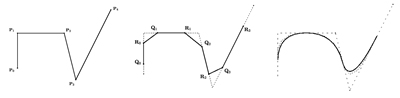
The figure above is copied from following source:
http://www.idav.ucdavis.edu/education/CAGDNotes/Chaikins-Algorithm/Chaikins-Algorithm.html