| |
VisLink: Revealing Relationships Amongst Visualizations |
Barbara Fritsch
Wolfgang Knecht |
|
|
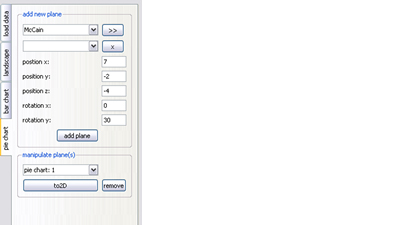
We tried to keep our graphical user interface (GUI) as simple as possible. For providing the most possible space for visualization part, we used QTabWidget. Through this step the following registers are created:
- dataset
- landscape
- bar chart
- pie chart
The big advantage is that this QTabWidget needs minimal size. Through the dataset tab users may load different datasets into our environment. The tabs map, bar chart and pie chart have more or less the same buildup. Due to visualization techniques different data sources are needed. But in each case users can define x, y, z position and rotation in x and y direction of a plane. If these values are not changed, they are automatically adapted to the next free position. The map plane needs no further source, bar chart works with one column that is illustrated and their corresponding short labels. At least pie chart uses more than one column. Therefore more columns can be chosen by ">>" and deleted by "x". Adding is not the only feature that is supported by the GUI. Animation from 3D to 2D and back to 2D is also possible as well as removing actual selected planes.
|
|