VisLink: Revealing Relationships Amongst Visualizations
Wolfgang Knecht
| start |
|---|
| GUI |
| dataset |
| visualization |
| linking |
| navigation |
| documentation |
Introduction
Based on the paper "VisLink: Revealing Relationships Amongst Visualizations" by Christopher Collins and Sheelagh Carpendale we developed this program within the course "Informationsvisualisierung" at the Vienna University of Technology.
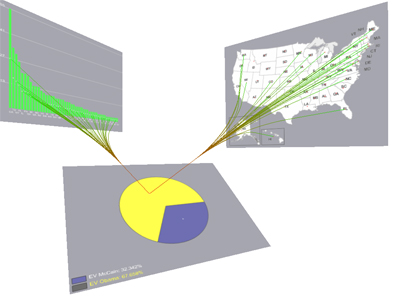
The program handles multiple different visualizations of a dataset which are drawn on separete planes in 3D space. To show the relations between these visualizations splines are drawn from the planes to the other planes.
Additional the user can interactive move and rotate each separate visualization-plane in 3D space to get a nice layout. To explore the data and getting a clearer overview there is the possibility to select a node of interest and then only relations depending on this selection are displayed.
Features
- multiple visualizations (extendable)
- visualization of relations
- interactive navigation
- selection of nodes for better overview
Downloads