|
|
|
Computer Graphics Group
Research Projects on Visualization
|
| Click here to see our recent publications ... |
| ViMaL [ started 2010 ] |
|
The ViMaL (Visualization Mapping Language) project aims to standardize visualization concepts.
|
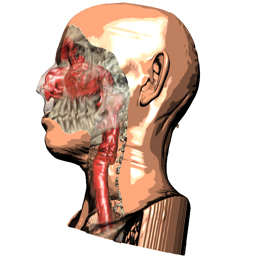
| Point-based Volume Graphics [ started 2006 ] |
| PVG aims allowing efficient leverage of resources by representing homogeneous regions
with just a few points and inhomogeneous regions with many points. Though many volume
visualization systems allow the specification of transfer functions,
illumination properties, cutting planes, etc. to explore the data, certain limitations apply:
features typically are unique and static. By representing components of a data set by points we
can overcome these limitations in a natural way. These capabilities are of
great importance in applications such as surgical planning, education, illustration, and for
investigation or exploration of data.
|
| DiagVis [ started 2006 ] |
| The DiagVis (Diagnostic Visualization) project aims to facilitate and to improve medical diagnostics.
The project focuses on radiological needs but also on related disciplines like surgical applications.
Reliability, stability and usability of the developed methods should be examined through the integration to
a medical workstation to allow a clinical evaluation.
|
| ExVisation
[ started 2005 ] |
| The project aims to develop novel methods for automatically generating expressive visualizations of complex volumetric data. |
| COMRADE
[ started 2003 ] |
| The project aims to explore the possibilities of MRI visualization
techniques, e.g., for virtual colonoscopy and orthopaedics, due to similarity
in their interests, and to develop a patient-friendly, effective screening
tool. The work will concentrate on identifying the specific application areas,
e.g., diagnostic investigation of Crohn's disease, and improving still
ineffective analysis steps of the visualization pipeline, such as data
enhancement, mapping to visual properties, etc. |
| ADAPT
Research Project [ 2002 - 2005 ] |
A considerable improvement in the area of volume visualisation and data
aquisition was achieved during the last years. This project will take advantage
of the high computational power of todays PC Workstations and highly
sophisticated algorithms in order to improve diagnosis. The targets are:
-
Computer Aided Diagnosis.
-
Visualization of deduced information from data analysis.
-
Reliability issues of medical data visualization.
-
Automatic and user steered segmentation.
|
| AngioVis
[ 2002 - 2004 ] |
This project deals with post-processing and visualization of large CTA
datasets of the peripheral extremities. The aim of this project is to develop a
diagnosis tool for detection and classification of arterial diseases in routine
clinical use. The goals cover:
-
Developing highly reliable visualization methods.
-
Speeding up post-processing by introducing automatic and semi-automatic tools.
-
Optimising the clinical workflow.
|
| Information
Visualization [ started 2002 ] |
| Information visualization is concerned with developing visual metaphors and
interaction techniques for abstract, high-dimensional data. A central goal is
the user-guided exploratory investigation of large data sets. |
| VisMed
Research Projects [ 1998 - 2002 ] |
This project deals with recent issues concerning interactivity and usability
of a volume visualization. The scope of this project thus is to adapt the
most critical aspects of well-known techniques to enable a cooperating company
to provide a software system, which directly will be used by radiologists. The
goals include:
-
Reducing and optimizing the parameter set of volume visualization techniques
-
Improving the run-time performance of high-quality visualization methods
-
Developing of interactive and intuitive user-interfaces
-
Visualizing the reliability of rendered images
-
Including collaboration and evaluation over the Internet
Summarizing, the results of this project will be parts of a PACS system which
is used in a real-world setting (radiologists at work) that includes state of
the art volume visualization techniques featuring optimized usability. |
| Visualization
of Complex Dynamical Systems [ 1993 - 1999 ] |
| Several projects on the Visualization of Complex Dynamical Systems have been
done. These projects include: visualization of higher dimensional dynamical
systems, texture based flow visualization, collaborative augmented reality for
exploring dynamical systems, visualization of Poincaré maps, stream arrows,
DynSys3D, visualization of econometric models. |
| Miscellaneous
Projects |
|
Various projects originating in our visualization research.
|
|