Information
- Publication Type: Master Thesis
- Workgroup(s)/Project(s):
- Date: April 2020
- Date (Start): 1. April 2019
- Date (End): 30. April 2020
- TU Wien Library:
- Diploma Examination: May 2020
- Open Access: yes
- First Supervisor:
- Pages: 104
- Keywords: Node-Link Diagram, Bipartite Projection
Abstract
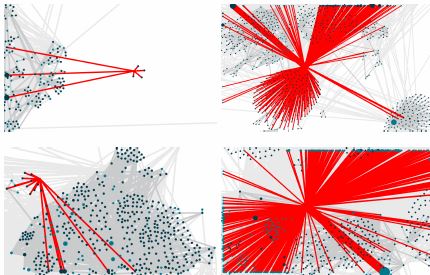
In this thesis, we introduce a web-based interactive exploration interface for a broadaudience to investigate large, weighted, bipartite graphs. The motivation of this workis based on theMedia Transparency Databasewhich arises from an Austrian law thatcompels legal entities to announce their advertisement spendings to media organizationsand meets the specified characteristics.Most current interactive exploration tools use complex visualizations because they weredeveloped for domain experts. As the Media Transparency Database is of potentialinterest to a broad audience, we provide a framework not just for domain experts butalso for inexperienced users.Therefore, we conducted systematic benchmarks to compare state-of-the-art web-basedrendering techniques. Furthermore, we compared the performance of different librariesto determine the most efficient rendering solution and current limitations of web-basedrendering.We introduce the concept of Firework Plots, which aims to provide a common visualizationthat scales well with the size of the data. Our visualization concept is based on intuitivenode-link visualization in combination with multiple visualization and interaction concepts.Hierarchical aggregation is used to improve scalability. Constrained, layered, force-basedgraph layouts, as well as firework animations and seamless zoom, are used to allowinexperienced users to drill down the graph hierarchy and track nodes through thehierarchy. Moreover, visibility management is used to reduce clutter and improveperformance.Based on the insights of our web-based graph rendering analysis, we implementedour framework and the concept of Firework Plots. We show the usefulness of theimplementation by discussing different use cases and comparing it to related work.Moreover, we conducted multiple benchmarks to show the rendering performance and calculation times.
Additional Files and Images
Additional images and videos
Additional files
Weblinks
BibTeX
@mastersthesis{Unger2020,
  title =      "Interactive Visual Exploration ofLarge Bipartite Graphs
               usingFirework Plots",
  author =     "Katharina Unger",
  year =       "2020",
  abstract =   "In this thesis, we introduce a web-based interactive
               exploration interface for a broadaudience to investigate
               large, weighted, bipartite graphs. The motivation of this
               workis based on theMedia Transparency Databasewhich arises
               from an Austrian law thatcompels legal entities to announce
               their advertisement spendings to media organizationsand
               meets the specified characteristics.Most current interactive
               exploration tools use complex visualizations because they
               weredeveloped for domain experts. As the Media Transparency
               Database is of potentialinterest to a broad audience, we
               provide a framework not just for domain experts butalso for
               inexperienced users.Therefore, we conducted systematic
               benchmarks to compare state-of-the-art web-basedrendering
               techniques. Furthermore, we compared the performance of
               different librariesto determine the most efficient rendering
               solution and current limitations of web-basedrendering.We
               introduce the concept of Firework Plots, which aims to
               provide a common visualizationthat scales well with the size
               of the data. Our visualization concept is based on
               intuitivenode-link visualization in combination with
               multiple visualization and interaction concepts.Hierarchical
               aggregation is used to improve scalability. Constrained,
               layered, force-basedgraph layouts, as well as firework
               animations and seamless zoom, are used to allowinexperienced
               users to drill down the graph hierarchy and track nodes
               through thehierarchy.  Moreover, visibility management is
               used to reduce clutter and improveperformance.Based on the
               insights of our web-based graph rendering analysis, we
               implementedour framework and the concept of Firework Plots.
               We show the usefulness of theimplementation by discussing
               different use cases and comparing it to related
               work.Moreover, we conducted multiple benchmarks to show the
               rendering performance and calculation times.",
  month =      apr,
  pages =      "104",
  address =    "Favoritenstrasse 9-11/E193-02, A-1040 Vienna, Austria",
  school =     "Research Unit of Computer Graphics, Institute of Visual
               Computing and Human-Centered Technology, Faculty of
               Informatics, TU Wien",
  keywords =   "Node-Link Diagram, Bipartite Projection",
  URL =        "https://www.cg.tuwien.ac.at/research/publications/2020/Unger2020/",
}


 Master Thesis
 Poster