

Thomas Ortner
Tight Integration of Visual Analysis and 3D Real-Time Rendering
Supervisor: Eduard Gröller
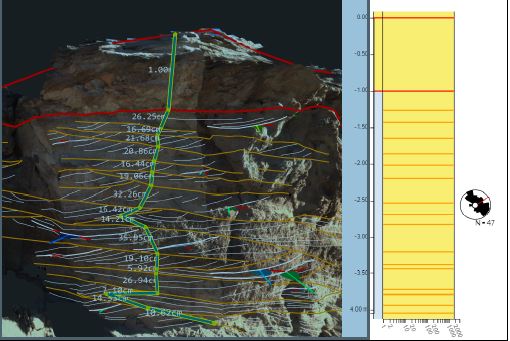
[image] [ PhD thesis]
Information
- Publication Type: PhD-Thesis
- Workgroup(s)/Project(s):
- Date: December 2020
- TU Wien Library:
- Open Access: yes
- 1st Reviewer: Michael Sedlmair
- 2nd Reviewer: Barbora Kozlikova
- Rigorosum: 12. March 2021
- First Supervisor: Eduard Gröller
- Pages: 116
- Keywords: Interactive Visualization, Integration Spatial and Non-Spatial Data Visualization, Methodology
Abstract
In many domains, such as urban planning, civil engineering, or disaster management, analysts need to deal with complex geometric data that also contain multivariate attributes. In addition to the visual analysis of the attribute data, typical tasks involve the localization and understanding of shapes, and judging spatial relations between geometric objects and the surrounding geometry, as for instance a digital terrain model. One way to address this in a visualization design is with coordinated multiple views, combining a 3D geometric view and attribute views by brushing & linking. However, a naive coordination of such views highlights challenges inherent to 3D visualization, as brushed objects may be occluded or lie outside of the current viewing volume. This can easily lead to disorientation and failing of localization, shape understanding, and spatial relation tasks, which ultimately breaks the iterative analysis loop provided through coordinated multiple views. In this thesis we explore different visual integration approaches for combining geometric and attribute views with respect to three application domains. In the first chapter, we deal with the domain of tunnel inspection and documentation, concerned with revealing patterns in tunnel crack data. We integrate a 3D geometric view with multiple attribute views to a coordinated multiple view solution and present several domain-specific visualization and interaction strategies to overcome the aforementioned challenges. We conclude the chapter with a methodological framework that provides visualization designers with integration guidelines regarding ‘Guided Navigation’, ‘Enhanced Geometric Rendering’, and ‘Similarity-based Analysis’. In the second chapter, we explore the potential visual impact of candidate buildings to a cityscape in the context of visibility-aware urban planning. We present the visualization system Vis-A-Ware to qualitatively and quantitatively evaluate and compare visibility data of candidate buildings with respect to a large number of viewpoints. Vis-A-Ware features a 3D view of an urban scene and a novel ranking view to compare and filter candidates with respect to visual impact data derived from visibility evaluations. The ranking view is tightly integrated with the other views for qualitative evaluation and to judge spatial relations in the cityscape. We provide users with a workflow to ultimately arrive at a small set of candidates supporting a jury-based decision-making process. In the third chapter, we are concerned with the domain of geological analysis of digital outcrop models (DOMs) which plays an essential role in the current NASA and ESA missions seeking signs of past life on Mars. Geologists interpret and measure DOMs, create sedimentary logs, and combine them in ‘correlation panels’. Currently, the creation of correlation panels is manual and therefore time-consuming, and inflexible. With InCorr we present a visualization solution that encompasses a 3D logging tool and an interactive data-driven correlation panel that evolves with the stratigraphic analysis. Correlation panels are an important part of geological publications. With InCorr we provide geologists with an interactive correlation panel that is reproducible and takes significantly less effort to create. The results of this thesis demonstrate that the tight integration of 3D geometric and attribute views is essential for certain domains and needs to be approached in a methodological way with thoughtful visualization and interaction design.Additional Files and Images

Weblinks
BibTeX
@phdthesis{Ortner_PhD,
  title =      "Tight Integration of Visual Analysis and 3D Real-Time
               Rendering",
  author =     "Thomas Ortner",
  year =       "2020",
  abstract =   "In many domains, such as urban planning, civil engineering,
               or disaster management, analysts need to deal with complex
               geometric data that also contain multivariate attributes. In
               addition to the visual analysis of the attribute data,
               typical tasks involve the localization and understanding of
               shapes, and judging spatial relations between geometric
               objects and the surrounding geometry, as for instance a
               digital terrain model. One way to address this in a
               visualization design is with coordinated multiple views,
               combining a 3D geometric view and attribute views by
               brushing & linking. However, a naive coordination of such
               views highlights challenges inherent to 3D visualization, as
               brushed objects may be occluded or lie outside of the
               current viewing volume. This can easily lead to
               disorientation and failing of localization, shape
               understanding, and spatial relation tasks, which ultimately
               breaks the iterative analysis loop provided through
               coordinated multiple views. In this thesis we explore
               different visual integration approaches for combining
               geometric and attribute views with respect to three
               application domains. In the first chapter, we deal with the
               domain of tunnel inspection and documentation, concerned
               with revealing patterns in tunnel crack data. We integrate a
               3D geometric view with multiple attribute views to a
               coordinated multiple view solution and present several
               domain-specific visualization and interaction strategies to
               overcome the aforementioned challenges. We conclude the
               chapter with a methodological framework that provides
               visualization designers with integration guidelines
               regarding ‘Guided Navigation’, ‘Enhanced Geometric
               Rendering’, and ‘Similarity-based Analysis’. In the
               second chapter, we explore the potential visual impact of
               candidate buildings to a cityscape in the context of
               visibility-aware urban planning. We present the
               visualization system Vis-A-Ware to qualitatively and
               quantitatively evaluate and compare visibility data of
               candidate buildings with respect to a large number of
               viewpoints. Vis-A-Ware features a 3D view of an urban scene
               and a novel ranking view to compare and filter candidates
               with respect to visual impact data derived from visibility
               evaluations. The ranking view is tightly integrated with the
               other views for qualitative evaluation and to judge spatial
               relations in the cityscape. We provide users with a workflow
               to ultimately arrive at a small set of candidates supporting
               a jury-based decision-making process. In the third chapter,
               we are concerned with the domain of geological analysis of
               digital outcrop models (DOMs) which plays an essential role
               in the current NASA and ESA missions seeking signs of past
               life on Mars. Geologists interpret and measure DOMs, create
               sedimentary logs, and combine them in ‘correlation
               panels’. Currently, the creation of correlation panels is
               manual and therefore time-consuming, and inflexible. With
               InCorr we present a visualization solution that encompasses
               a 3D logging tool and an interactive data-driven correlation
               panel that evolves with the stratigraphic analysis.
               Correlation panels are an important part of geological
               publications. With InCorr we provide geologists with an
               interactive correlation panel that is reproducible and takes
               significantly less effort to create. The results of this
               thesis demonstrate that the tight integration of 3D
               geometric and attribute views is essential for certain
               domains and needs to be approached in a methodological way
               with thoughtful visualization and interaction design.",
  month =      dec,
  pages =      "116",
  address =    "Favoritenstrasse 9-11/E193-02, A-1040 Vienna, Austria",
  school =     "Research Unit of Computer Graphics, Institute of Visual
               Computing and Human-Centered Technology, Faculty of
               Informatics, TU Wien ",
  keywords =   "Interactive Visualization, Integration Spatial and
               Non-Spatial Data Visualization, Methodology",
  URL =        "https://www.cg.tuwien.ac.at/research/publications/2020/Ortner_PhD/",
}