Information
- Publication Type: Master Thesis
- Workgroup(s)/Project(s):
- Date: November 2020
- Date (Start): 12. January 2020
- Date (End): 24. November 2020
- TU Wien Library:
- Second Supervisor: Christoph Heinzl
- Diploma Examination: 24. November 2020
- Open Access: yes
- First Supervisor: Eduard Gröller

Abstract
In safety-critical areas such as aeronautics, but also in other sectors such as the leisure industry, the advancement of respective products is largely driven by the improvement of the materials used. In order to analyze the targeted properties of these new materials, data of the internal structures is generated, using imaging techniques such as X-ray computed tomography (XCT), which is then analyzed in detail using segmentation and quantification algorithms. For materials scientists, the exact design of the internal structures is crucial for the characterization of materials and a comparison of several material candidates based on their characteristics is therefore indispensable for the investigation of di˙erent manufacturing and optimization processes or property behavior.
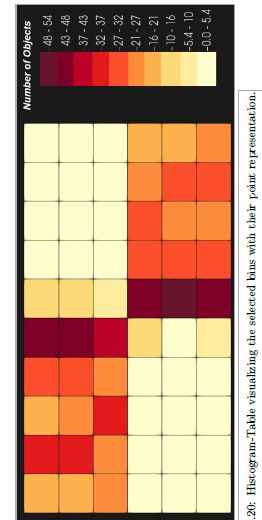
Currently, material scientists are dependent on sequential comparisons when analyzing several material candidates. Distributions of the individual attributes across the material systems need to be compared, which is why this task is typically cognitively demanding, time consuming, and thus error-prone. This work aims to support domain experts in their daily tasks of analysing large ensembles of material data. For this purpose we developed a comparative visualization framework that provides a holistic picture of similarities and dissimilarities in the data by means of an overview visualization and three detailed visualization techniques. Using the dimension reduction method Multidimensional Scaling, the individual structures are summarized and rendered in a table-based visualization technique called Histogram-Table. Information, describing in which attributes the structures are most similar as well as their exact characteristics, is evaluated by statistical calculations, the results of which are visualized in a bar chart and box plot. Finally, the linear correlations between the individual characteristics can be explored in a correlation map. We present the usability of this visualization system by means of three concrete usage scenarios and verify its applicability by means of a qualitative study with 12 material experts. The knowledge gained from our work represents a significant step in the field of comparative material analysis of high-dimensional data and supports experts in making their work easier and more eÿcient.
Additional Files and Images
Additional images and videos
Additional files
Weblinks
BibTeX
@mastersthesis{Heim_2020,
  title =      "Visual Comparison of Multivariate Data Ensembles",
  author =     "Anja Heim",
  year =       "2020",
  abstract =   "In safety-critical areas such as aeronautics, but also in
               other sectors such as the leisure industry, the advancement
               of respective products is largely driven by the improvement
               of the materials used. In order to analyze the targeted
               properties of these new materials, data of the internal
               structures is generated, using imaging techniques such as
               X-ray computed tomography (XCT), which is then analyzed in
               detail using segmentation and quantification algorithms. For
               materials scientists, the exact design of the internal
               structures is crucial for the characterization of materials
               and a comparison of several material candidates based on
               their characteristics is therefore indispensable for the
               investigation of di˙erent manufacturing and optimization
               processes or property behavior. Currently, material
               scientists are dependent on sequential comparisons when
               analyzing several material candidates. Distributions of the
               individual attributes across the material systems need to be
               compared, which is why this task is typically cognitively
               demanding, time consuming, and thus error-prone. This work
               aims to support domain experts in their daily tasks of
               analysing large ensembles of material data. For this purpose
               we developed a comparative visualization framework that
               provides a holistic picture of similarities and
               dissimilarities in the data by means of an overview
               visualization and three detailed visualization techniques.
               Using the dimension reduction method Multidimensional
               Scaling, the individual structures are summarized and
               rendered in a table-based visualization technique called
               Histogram-Table. Information, describing in which attributes
               the structures are most similar as well as their exact
               characteristics, is evaluated by statistical calculations,
               the results of which are visualized in a bar chart and box
               plot. Finally, the linear correlations between the
               individual characteristics can be explored in a correlation
               map. We present the usability of this visualization system
               by means of three concrete usage scenarios and verify its
               applicability by means of a qualitative study with 12
               material experts. The knowledge gained from our work
               represents a significant step in the field of comparative
               material analysis of high-dimensional data and supports
               experts in making their work easier and more eÿcient.",
  month =      nov,
  address =    "Favoritenstrasse 9-11/E193-02, A-1040 Vienna, Austria",
  school =     "Research Unit of Computer Graphics, Institute of Visual
               Computing and Human-Centered Technology, Faculty of
               Informatics, TU Wien",
  URL =        "https://www.cg.tuwien.ac.at/research/publications/2020/Heim_2020/",
}


 Master Thesis
 Poster
