

Nicholas Waldin, Manuela Waldner , Mathieu Le Muzic, Eduard Gröller, David Goodsell, Ludovic Autin, Arthur Olson, Ivan Viola
Cuttlefish: Color Mapping for Dynamic Multi‐Scale Visualizations
Computer Graphics Forum, 38(6):150-164, March 2019. [Open Access Article in Wiley Online Library]
Information
- Publication Type: Journal Paper (without talk)
- Workgroup(s)/Project(s):
- Date: March 2019
- DOI: 10.1111/cgf.13611
- Journal: Computer Graphics Forum
- Number: 6
- Volume: 38
- Pages: 150 – 164
- Keywords: multiscale visualization, illustrative visualization, molecular visualization
Abstract
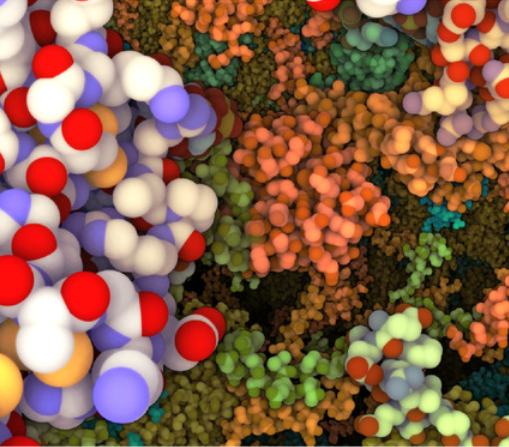
Visualizations of hierarchical data can often be explored interactively. For example, in geographic visualization, there are continents, which can be subdivided into countries, states, counties and cities. Similarly, in models of viruses or bacteria at the highest level are the compartments, and below that are macromolecules, secondary structures (such as α‐helices), amino‐acids, and on the finest level atoms. Distinguishing between items can be assisted through the use of color at all levels. However, currently, there are no hierarchical and adaptive color mapping techniques for very large multi‐scale visualizations that can be explored interactively. We present a novel, multi‐scale, color‐mapping technique for adaptively adjusting the color scheme to the current view and scale. Color is treated as a resource and is smoothly redistributed. The distribution adjusts to the scale of the currently observed detail and maximizes the color range utilization given current viewing requirements. Thus, we ensure that the user is able to distinguish items on any level, even if the color is not constant for a particular feature. The coloring technique is demonstrated for a political map and a mesoscale structural model of HIV. The technique has been tested by users with expertise in structural biology and was overall well received.Additional Files and Images
Weblinks
BibTeX
@article{waldin-2019-ccm,
  title =      "Cuttlefish: Color Mapping for Dynamic Multi‐Scale
               Visualizations",
  author =     "Nicholas Waldin and Manuela Waldner and Mathieu Le Muzic and
               Eduard Gr\"{o}ller and David Goodsell and Ludovic Autin and
               Arthur Olson and Ivan Viola",
  year =       "2019",
  abstract =   "Visualizations of hierarchical data can often be explored
               interactively. For example, in geographic visualization,
               there are continents, which can be subdivided into
               countries, states, counties and cities. Similarly, in models
               of viruses or bacteria at the highest level are the
               compartments, and below that are macromolecules, secondary
               structures (such as α‐helices), amino‐acids, and on the
               finest level atoms. Distinguishing between items can be
               assisted through the use of color at all levels. However,
               currently, there are no hierarchical and adaptive color
               mapping techniques for very large multi‐scale
               visualizations that can be explored interactively. We
               present a novel, multi‐scale, color‐mapping technique
               for adaptively adjusting the color scheme to the current
               view and scale. Color is treated as a resource and is
               smoothly redistributed. The distribution adjusts to the
               scale of the currently observed detail and maximizes the
               color range utilization given current viewing requirements.
               Thus, we ensure that the user is able to distinguish items
               on any level, even if the color is not constant for a
               particular feature. The coloring technique is demonstrated
               for a political map and a mesoscale structural model of HIV.
               The technique has been tested by users with expertise in
               structural biology and was overall well received.",
  month =      mar,
  doi =        "10.1111/cgf.13611",
  journal =    "Computer Graphics Forum",
  number =     "6",
  volume =     "38",
  pages =      "150--164",
  keywords =   "multiscale visualization, illustrative visualization,
               molecular visualization",
  URL =        "https://www.cg.tuwien.ac.at/research/publications/2019/waldin-2019-ccm/",
}