

Vahan Yoghourdjian, Daniel Archambault, Stephan Diehl, Tim Dwyer, Karsten Klein, Helen C. Purchase, Hsiang-Yun Wu
Exploring the limits of complexity: A survey of empirical studies ongraph visualisation
Visual Informatics, 2(4):264-282, January 2019. [ paper]
Information
- Publication Type: Journal Paper (without talk)
- Workgroup(s)/Project(s):
- Date: January 2019
- DOI: https://doi.org/10.1016/j.visinf.2018.12.006
- ISSN: 2468-502X
- Journal: Visual Informatics
- Number: 4
- Open Access: yes
- Volume: 2
- Pages: 264 – 282
- Keywords: Graph visualisation, Network visualisation, node–link diagrams, Evaluations, Empirical studies, Cognitive scalability
Abstract
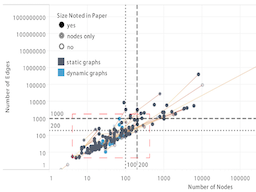
For decades, researchers in information visualisation and graph drawing have focused on developing techniques for the layout and display of very large and complex networks. Experiments involving human participants have also explored the readability of different styles of layout and representations for such networks. In both bodies of literature, networks are frequently referred to as being ‘large’ or ‘complex’, yet these terms are relative. From a human-centred, experiment point-of-view, what constitutes ‘large’ (for example) depends on several factors, such as data complexity, visual complexity, and the technology used. In this paper, we survey the literature on human-centred experiments to understand how, in practice, different features and characteristics of node–link diagrams affect visual complexity.Additional Files and Images

Weblinks
BibTeX
@article{YOGHOURDJIAN2019,
  title =      "Exploring the limits of complexity: A survey of empirical
               studies ongraph visualisation",
  author =     "Vahan Yoghourdjian and Daniel Archambault and Stephan Diehl
               and Tim  Dwyer and Karsten Klein and Helen  C. Purchase and
               Hsiang-Yun Wu",
  year =       "2019",
  abstract =   "For decades, researchers in information visualisation and
               graph drawing have focused on developing techniques for the
               layout and display of very large and complex networks.
               Experiments involving human participants have also explored
               the readability of different styles of layout and
               representations for such networks. In both bodies of
               literature, networks are frequently referred to as being
               ‘large’ or ‘complex’, yet these terms are relative.
               From a human-centred, experiment point-of-view, what
               constitutes ‘large’ (for example) depends on several
               factors, such as data complexity, visual complexity, and the
               technology used. In this paper, we survey the literature on
               human-centred experiments to understand how, in practice,
               different features and characteristics of node–link
               diagrams affect visual complexity.",
  month =      jan,
  doi =        "https://doi.org/10.1016/j.visinf.2018.12.006",
  issn =       "2468-502X",
  journal =    "Visual Informatics",
  number =     "4",
  volume =     "2",
  pages =      "264--282",
  keywords =   "Graph visualisation, Network visualisation, node–link
               diagrams, Evaluations, Empirical studies, Cognitive
               scalability",
  URL =        "https://www.cg.tuwien.ac.at/research/publications/2019/YOGHOURDJIAN2019/",
}