

Klaus Eckelt
Data-Driven User Guidance in Multi-Attribute Data Exploration
[image] [ Poster]
Information
- Publication Type: Master Thesis
- Workgroup(s)/Project(s):
- Date: August 2018
- Date (Start): 3. January 2018
- Date (End): 18. August 2018
- TU Wien Library:
- Open Access: yes
- First Supervisor: Eduard Gröller

Abstract
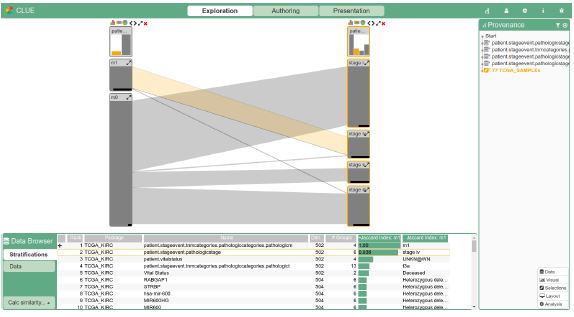
Seeking relationships in multi-dimensional datasets is a common task, but can quickly become tedious due to the heterogeneity and increasing size of the data. Its visualization can be approached in a variety of ways: (i) projection techniques decrease the number of dimensions to a fraction before visualizing items, creating clusters where similarities in the high-level space may be derived; (ii) overview visualization techniques display selected attributes and all of their items’ values to discover patterns and find relationships; (iii) tabular techniques give an insight into the individual items and thus favor their detailed analysis and exploration. However, while the interactive selection of a data subset during exploration is most easily done with tabular visualizations, finding relationships and patterns is not. Also, with overview techniques the number of attribute combinations quickly outgrows reasonable dimensions. In this thesis, a data-driven touring process for Visual Analytics (VA) tools is presented that guides users in discovering relationships for a data subset of their interest. Based on the user’s selection, attributes that show some kind of similarity are presented. The selection can be done on attribute and item level. While a selected attribute is compared to all other attributes in the dataset, item sets are compared to the individual categories of attributes. This comparison can be based on a number of similarity measures. To cope with heterogeneity of data types, numerical attributes are discretized to achieve maximum similarity. In hierarchical attributes, the most similar subtree is sought. The touring process is also independent of the data domain and its visualization. This independence is demonstrated by the use of three different datasets and the integration of the touring process into two VA systems. These extended systems were shown to medical experts of the Kepler University Hospital, who will use them in the near future. Their feedback was incorporated to improve the guidance process.Additional Files and Images


Weblinks
No further information available.BibTeX
@mastersthesis{Eckelt_2018_01,
  title =      "Data-Driven User Guidance in Multi-Attribute Data
               Exploration",
  author =     "Klaus Eckelt",
  year =       "2018",
  abstract =   "Seeking relationships in multi-dimensional datasets is a
               common task, but can quickly become tedious due to the
               heterogeneity and increasing size of the data. Its
               visualization can be approached in a variety of ways: (i)
               projection techniques decrease the number of dimensions to a
               fraction before visualizing items, creating clusters where
               similarities in the high-level space may be derived; (ii)
               overview visualization techniques display selected
               attributes and all of their items’ values to discover
               patterns and find relationships; (iii) tabular techniques
               give an insight into the individual items and thus favor
               their detailed analysis and exploration. However, while the
               interactive selection of a data subset during exploration is
               most easily done with tabular visualizations, finding
               relationships and patterns is not. Also, with overview
               techniques the number of attribute combinations quickly
               outgrows reasonable dimensions. In this thesis, a
               data-driven touring process for Visual Analytics (VA) tools
               is presented that guides users in discovering relationships
               for a data subset of their interest. Based on the user’s
               selection, attributes that show some kind of similarity are
               presented. The selection can be done on attribute and item
               level. While a selected attribute is compared to all other
               attributes in the dataset, item sets are compared to the
               individual categories of attributes. This comparison can be
               based on a number of similarity measures. To cope with
               heterogeneity of data types, numerical attributes are
               discretized to achieve maximum similarity. In hierarchical
               attributes, the most similar subtree is sought. The touring
               process is also independent of the data domain and its
               visualization. This independence is demonstrated by the use
               of three different datasets and the integration of the
               touring process into two VA systems. These extended systems
               were shown to medical experts of the Kepler University
               Hospital, who will use them in the near future. Their
               feedback was incorporated to improve the guidance process.",
  month =      aug,
  address =    "Favoritenstrasse 9-11/E193-02, A-1040 Vienna, Austria",
  school =     "Institute of Computer Graphics and Algorithms, Vienna
               University of Technology ",
  URL =        "https://www.cg.tuwien.ac.at/research/publications/2018/Eckelt_2018_01/",
}