

Tobias Klein, Stefan Bruckner , Eduard Gröller, Markus Hadwiger, Peter Rautek
Towards Interactive Visual Exploration of Parallel Programs using a Domain-Specific Language
Poster shown at 4th International Workshop on OpenCL (IWOCL '16)
()
Information
- Publication Type: Poster
- Workgroup(s)/Project(s): not specified
- Date: April 2016
- Publisher: ACM
- Location: Vienna, Austria
- Event: 4th International Workshop on OpenCL (IWOCL '16)
Abstract
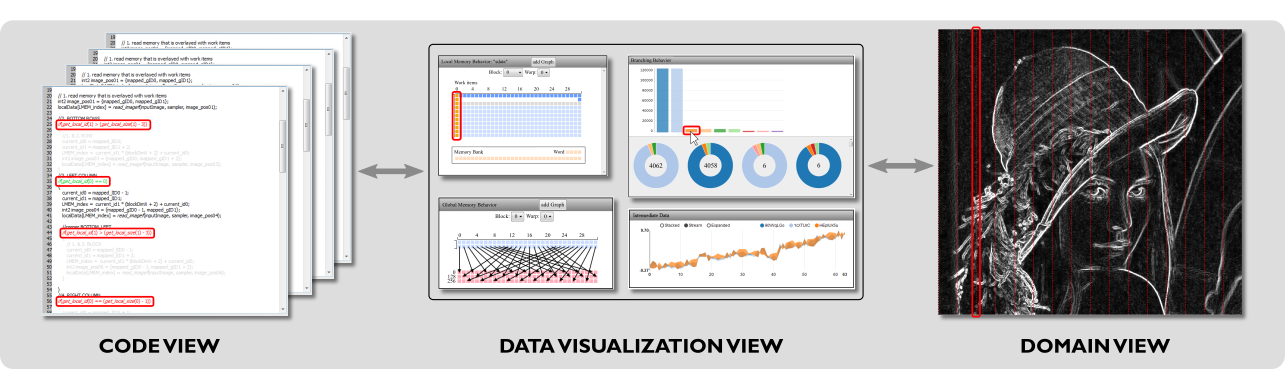
The use of GPUs and the massively parallel computing paradigm have become wide-spread. We describe a framework for the interactive visualization and visual analysis of the run-time behavior of massively parallel programs, especially OpenCL kernels. This facilitates understanding a program's function and structure, finding the causes of possible slowdowns, locating program bugs, and interactively exploring and visually comparing different code variants in order to improve performance and correctness. Our approach enables very specific, user-centered analysis, both in terms of the recording of the run-time behavior and the visualization itself. Instead of having to manually write instrumented code to record data, simple code annotations tell the source-to-source compiler which code instrumentation to generate automatically. The visualization part of our framework then enables the interactive analysis of kernel run-time behavior in a way that can be very specific to a particular problem or optimization goal, such as analyzing the causes of memory bank conflicts or understanding an entire parallel algorithm.Additional Files and Images


Weblinks
No further information available.BibTeX
@misc{klein-2016-WCL,
  title =      "Towards Interactive Visual Exploration of Parallel Programs
               using a Domain-Specific Language",
  author =     "Tobias Klein and Stefan Bruckner and Eduard Gr\"{o}ller and
               Markus Hadwiger and Peter Rautek",
  year =       "2016",
  abstract =   "The use of GPUs and the massively parallel computing
               paradigm have become wide-spread. We describe a framework
               for the interactive visualization and visual analysis of the
               run-time behavior of massively parallel programs, especially
               OpenCL kernels. This facilitates understanding a program's
               function and structure, finding the causes of possible
               slowdowns, locating program bugs, and interactively
               exploring and visually comparing different code variants in
               order to improve performance and correctness. Our approach
               enables very specific, user-centered analysis, both in terms
               of the recording of the run-time behavior and the
               visualization itself. Instead of having to manually write
               instrumented code to record data, simple code annotations
               tell the source-to-source compiler which code
               instrumentation to generate automatically. The visualization
               part of our framework then enables the interactive analysis
               of kernel run-time behavior in a way that can be very
               specific to a particular problem or optimization goal, such
               as analyzing the causes of memory bank conflicts or
               understanding an entire parallel algorithm.",
  month =      apr,
  publisher =  "ACM",
  location =   "Vienna, Austria",
  event =      "4th International Workshop on OpenCL (IWOCL '16)",
  Conference date = "Poster presented at 4th International Workshop on OpenCL
               (IWOCL '16) ()",
  URL =        "https://www.cg.tuwien.ac.at/research/publications/2016/klein-2016-WCL/",
}