

Sanjin Rados, Rainer Splechtna, Kresimir Matkovic , Mario Duras, Eduard Gröller, Helwig Hauser
Towards Quantitative Visual Analytics with Structured Brushing and Linked Statistics
Computer Graphics Forum (2016), 35(3):251-260, 2016. [image] [ paper]
Information
- Publication Type: Journal Paper with Conference Talk
- Workgroup(s)/Project(s):
- Date: 2016
- Journal: Computer Graphics Forum (2016)
- Volume: 35
- Number: 3
- Location: EUROVIS 2016
- Pages: 251 – 260
Abstract
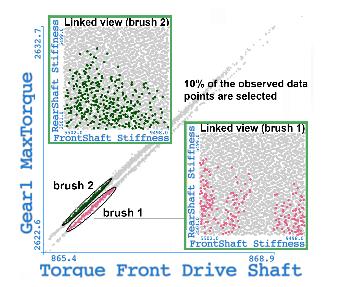
Until now a lot of visual analytics predominantly delivers qualitative results—based, for example, on a continuous color map or a detailed spatial encoding. Important target applications, however, such as medical diagnosis and decision making, clearly benefit from quantitative analysis results. In this paper we propose several specific extensions to the well-established concept of linking&brushing in order to make the analysis results more quantitative. We structure the brushing space in order to improve the reproducibility of the brushing operation, e.g., by introducing the percentile grid. We also enhance the linked visualization with overlaid descriptive statistics to enable a more quantitative reading of the resulting focus+context visualization. Addition- ally, we introduce two novel brushing techniques: the percentile brush and the Mahalanobis brush. Both use the underlying data to support statistically meaningful interactions with the data. We illustrate the use of the new techniques in the context of two case studies, one based on meteorological data and the other one focused on data from the automotive industry where we evaluate a shaft design in the context of mechanical power transmission in cars.Additional Files and Images

Weblinks
No further information available.BibTeX
@article{Groeller_2016_P2,
  title =      "Towards Quantitative Visual Analytics with Structured
               Brushing and Linked Statistics",
  author =     "Sanjin Rados and Rainer Splechtna and Kresimir Matkovic and
               Mario Duras and Eduard Gr\"{o}ller and Helwig Hauser",
  year =       "2016",
  abstract =   "Until now a lot of visual analytics predominantly delivers
               qualitative results—based, for example, on a continuous
               color map or a detailed spatial encoding. Important target
               applications, however, such as medical diagnosis and
               decision making, clearly benefit from quantitative analysis
               results. In this paper we propose several specific
               extensions to the well-established concept of
               linking&brushing in order to make the analysis results more
               quantitative. We structure the brushing space in order to
               improve the reproducibility of the brushing operation, e.g.,
               by introducing the percentile grid. We also enhance the
               linked visualization with overlaid descriptive statistics to
               enable a more quantitative reading of the resulting
               focus+context visualization. Addition- ally, we introduce
               two novel brushing techniques: the percentile brush and the
               Mahalanobis brush. Both use the underlying data to support
               statistically meaningful interactions with the data. We
               illustrate the use of the new techniques in the context of
               two case studies, one based on meteorological data and the
               other one focused on data from the automotive industry where
               we evaluate a shaft design in the context of mechanical
               power transmission in cars.",
  journal =    "Computer Graphics Forum (2016)",
  volume =     "35",
  number =     "3",
  pages =      "251--260",
  URL =        "https://www.cg.tuwien.ac.at/research/publications/2016/Groeller_2016_P2/",
}