

 Poster
 Thesis
Information
- Publication Type: Master Thesis
- Workgroup(s)/Project(s):
- Date: January 2013
- TU Wien Library:
- First Supervisor:

Abstract
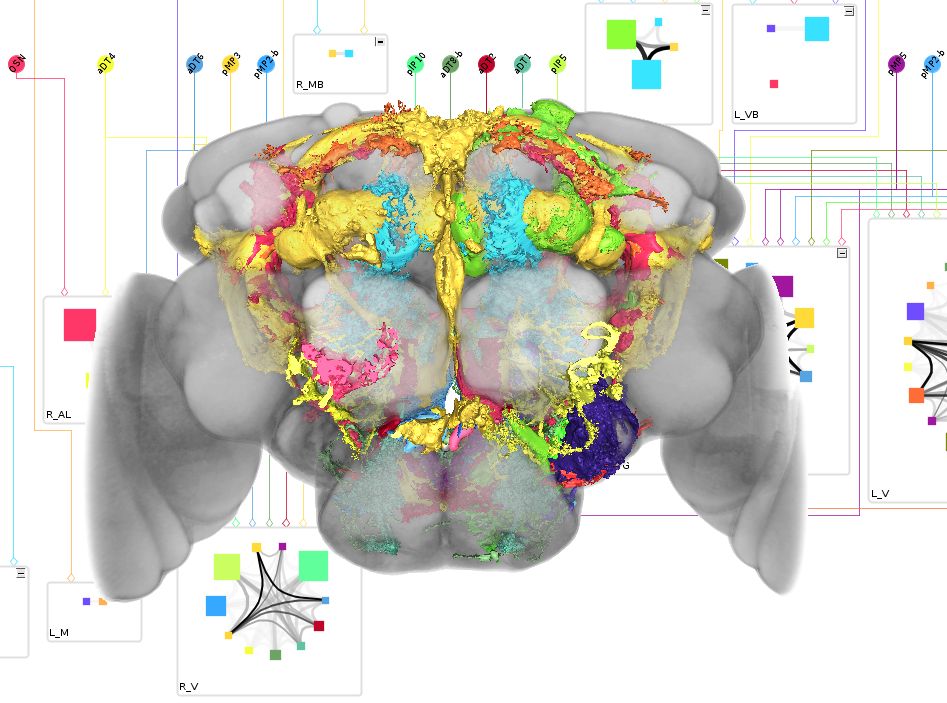
Neuroscientists study the function of neural circuits in the brain of the common fruit fly Drosophila Melanogaster to discover how complex behavior is generated. Through a combination of molecular-genetic techniques and confocal microscopy the scientists are able to highlight single neurons and produce three-dimensional images of the fly’s brain. Neurons are segmented, annotated, and compiled into a digital atlas. Brain atlases offer tools for exploring and analyzing their underlying data. To establish models of neural information processing, knowledge about possible connections between individual neurons is necessary. Connections can occur when arborizations (the terminal branchings of nerve fibers) of two neurons are overlapping. However, analyzing overlapping objects using traditional volumetric visualization is difficult since the examined objects occlude each other. A more abstract form of representation is therefore required. The work in this thesis was motivated by a manually constructed two-dimensional circuit diagram of potential neuronal connections that represents a novel way of visualizing neural connectivity data. Through abstracting the complex volumetric data, the diagram offers an intuitive and clear overview of potential connectivity. In collaboration with a group of neuroscientists neuroMap was designed and implemented in an attempt to deliver the visual features and encoded information of this circuit diagram in an automatically generated interactive graph, with the goal of facilitating hypothesis formation and exploration of neural connectivity. In this thesis the visual and interaction design decisions that went into neuroMap are presented, as well as the result of evaluative discussions that shows that the integration of this novel type of visualization into the existing datamining infrastructure of our clients is indeed beneficial to their research.Additional Files and Images


Weblinks
No further information available.BibTeX
@mastersthesis{Sorger_2013_nMI,
  title =      "neuroMap - Interactive Graph-Visualization of the Fruit
               Fly’s Neural Circuit",
  author =     "Johannes Sorger",
  year =       "2013",
  abstract =   "Neuroscientists study the function of neural circuits in the
               brain of the common fruit fly Drosophila Melanogaster to
               discover how complex behavior is generated. Through a
               combination of molecular-genetic techniques and confocal
               microscopy the scientists are able to highlight single
               neurons and produce three-dimensional images of the fly’s
               brain. Neurons are segmented, annotated, and compiled into a
               digital atlas. Brain atlases offer tools for exploring and
               analyzing their underlying data. To establish models of
               neural information processing, knowledge about possible
               connections between individual neurons is necessary.
               Connections can occur when arborizations (the terminal
               branchings of nerve fibers) of two neurons are overlapping.
               However, analyzing overlapping objects using traditional
               volumetric visualization is difficult since the examined
               objects occlude each other. A more abstract form of
               representation is therefore required. The work in this
               thesis was motivated by a manually constructed
               two-dimensional circuit diagram of potential neuronal
               connections that represents a novel way of visualizing
               neural connectivity data. Through abstracting the complex
               volumetric data, the diagram offers an intuitive and clear
               overview of potential connectivity. In collaboration with a
               group of neuroscientists neuroMap was designed and
               implemented in an attempt to deliver the visual features and
               encoded information of this circuit diagram in an
               automatically generated interactive graph, with the goal of
               facilitating hypothesis formation and exploration of neural
               connectivity. In this thesis the visual and interaction
               design decisions that went into neuroMap are presented, as
               well as the result of evaluative discussions that shows that
               the integration of this novel type of visualization into the
               existing datamining infrastructure of our clients is indeed
               beneficial to their research.",
  month =      jan,
  address =    "Favoritenstrasse 9-11/E193-02, A-1040 Vienna, Austria",
  school =     "Institute of Computer Graphics and Algorithms, Vienna
               University of Technology ",
  URL =        "https://www.cg.tuwien.ac.at/research/publications/2013/Sorger_2013_nMI/",
}