

Christian Basch
Animated Transitions Across Multiple Dimensions for Volumetric Data
[ Thesis]
Information
- Publication Type: Master Thesis
- Workgroup(s)/Project(s):
- Date: October 2011
- TU Wien Library:
- First Supervisor:

Abstract
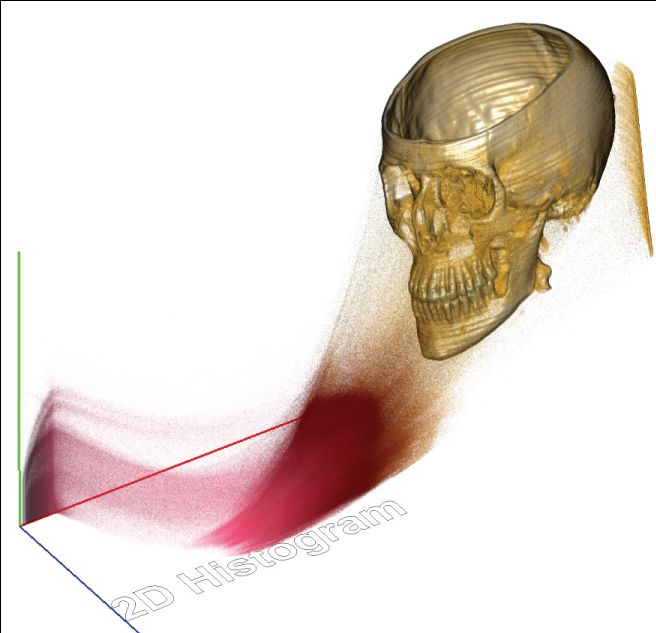
There are several techniques, that can be used to visualize volumetric data. A data set can be illustrated using slicing (depicting arbitrary slices through the volume), direct volume rendering (DVR), or in a more abstract way, histograms and scatter plots. Usually these different methods of visualization are being applied separately. To recognize coherencies between the representations, methods based on Linking and Brushing can be utilized. These methods highlight voxels in one view, as soon as they are selected in another one. Coming from scientific visualization, these methods are very useful, when selecting voxels from 2D data representations, like scatter plots. Of course they are less useful, when trying to select voxels directly from the volume. Therefore this thesis explored methods, that are not based on selection and highlighting. Rather, the correlation between different representations is shown by moving voxels between different volume representations. As a basis, methods like staggered animation, acceleration, and deceleration were adopted, which had been previously used in the graphical analysis of statistical data.Additional Files and Images

Weblinks
No further information available.BibTeX
@mastersthesis{Basch_2011_ATA,
  title =      "Animated Transitions Across Multiple Dimensions for
               Volumetric Data",
  author =     "Christian Basch",
  year =       "2011",
  abstract =   "There are several techniques, that can be used to visualize
               volumetric data. A data set can be illustrated using slicing
               (depicting arbitrary slices through the volume), direct
               volume rendering (DVR), or in a more abstract way,
               histograms and scatter plots. Usually these different
               methods of visualization are being applied separately. To
               recognize coherencies between the representations, methods
               based on Linking and Brushing can be utilized. These methods
               highlight voxels in one view, as soon as they are selected
               in another one. Coming from scientific visualization, these
               methods are very useful, when selecting voxels from 2D data
               representations, like scatter plots. Of course they are less
               useful, when trying to select voxels directly from the
               volume. Therefore this thesis explored methods, that are not
               based on selection and highlighting. Rather, the correlation
               between different representations is shown by moving voxels
               between different volume representations. As a basis,
               methods like staggered animation, acceleration, and
               deceleration were adopted, which had been previously used in
               the graphical analysis of statistical data.",
  month =      oct,
  address =    "Favoritenstrasse 9-11/E193-02, A-1040 Vienna, Austria",
  school =     "Institute of Computer Graphics and Algorithms, Vienna
               University of Technology ",
  URL =        "https://www.cg.tuwien.ac.at/research/publications/2011/Basch_2011_ATA/",
}