

In many aspects of our modern lives we face the problem of having to make sense of large amounts of data. This applies to scientists trying to make sense of their experiments and simulations, to bankers and traders trying to understand the dynamics of the financial markets, and to large enterprises which need to understand the principles behind demand and supply—to name just a few examples. The basic problem in all these cases is that people need to identify important and/or unexpected features in large simulated or captured datasets. Visualization is the domain that facilitates this process of sense-making by dramatically simplifying the process of obtaining an understanding of the data—by representing data visually and thus amplifying people’s cognition. This inherent capability of (good) visualization techniques to amplify human cognition, however, is no longer enough to be able to make sense of today’s huge datasets. To be able to see the essential aspects we need dedicated mechanisms that abstract away the (unnecessary) detail to, in turn, allow the user of the visualization to focus on the important elements. The crucial problem in this context is that it is impossible to know what is important and what is not in a general way—importance changes based on the research question, on the application domain, on the data size, on the user, on the specific situation, etc. Visualization technology therefore needs to support dynamic change of visual abstraction of the data to reflect these contextual changes. The fundamental research challenge in visualization for us is to get an understanding of what (visual) abstraction really is, what it means, how it can be controlled, and how it is, can be, and should be used in visualization.
Funding
- FWF I 2953-N31
Research Areas
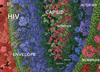
 In this research area, we develop new visualization techniques to support biologists in data analysis and create visualizations to disseminate scientific discoveries in biology.
 In this research area, we develop rendering methods that are inspired by scientific illustrations, in order to make complex biological information more intuitive to understand and more pleasant to read.
Publications
11 Publications found:
Download list as Bibtex, HTML (Advanced, Expert), JSON (with referenced objects), CSV, Permalink
| Image | Bib Reference | Publication Type |
|---|---|---|
| 2020 | ||
 |
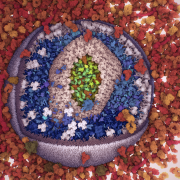
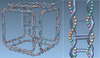
Elisa De Llano, Haichao Miao, Yasaman Ahmadi, Armanda J Wilson, Morgan Beeby, Ivan Viola , Ivan Barisic , Ivan BarisicAdenita: interactive 3D modelling and visualization of DNA nanostructures Nucleic Acids Research, July 2020. |
Journal Paper (without talk) |
 |
Sarkis Halladjian, Haichao Miao, David Kouřil, Eduard Gröller, Ivan Viola, Tobias Isenberg ScaleTrotter: Illustrative Visual Travels Across Negative Scales IEEE Transactions on Visualization and Computer Graphics, 26(1), January 2020. [  paper] paper] |
Journal Paper with Conference Talk |
| 2019 | ||
 |
Haichao Miao, Elisa De Llano, Ivan Viola, Ivan Barisic Interactive Visual Analysis for the Design of DNA Nanostructures Poster shown at NANTECH 2019 – Nucleic Acid Nanotechnology: From Algorithmic Design to Biochemical Applications – Espoo, Finland (27. May 2019-29. May 2019) |
Poster |
 |
David Kouřil, Ladislav Čmolík, Barbora Kozlikova, Hsiang-Yun Wu, Graham Johnson, David Goodsell, Arthur Olson, Eduard Gröller, Ivan Viola Labels on Levels: Labeling of Multi-Scale Multi-Instance and Crowded 3D Biological Environments IEEE Transactions on Visualization and Computer Graphics, 25:977-986, January 2019. [  paper] [Conference Talk Recording] paper] [Conference Talk Recording] |
Journal Paper with Conference Talk |
| 2018 | ||
 |
Elisa De Llano, Haichao Miao, Tobias Isenberg, Eduard Gröller, Ivan Viola, Ivan Barisic A Preview to Adenita: Visualization and Modeling of DNA Nanostructures Poster shown at 3rd Functional DNA Nanotechnology Workshop ( 6. June 2018- 8. June 2018) |
Poster |
 |
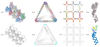
Haichao Miao, Elisa De Llano, Tobias Isenberg, Eduard Gröller, Ivan Barisic, Ivan Viola DimSUM: Dimension and Scale Unifying Maps for Visual Abstraction of DNA Origami Structures Computer Graphics Forum, 37(3), June 2018. [  Paper] Paper] |
Journal Paper with Conference Talk |
 |
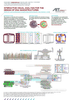
Haichao Miao, Elisa De Llano, Johannes Sorger, Yasaman Ahmadi, Tadija Kekic, Tobias Isenberg, Eduard Gröller, Ivan Barisic, Ivan Viola Multiscale Visualization and Scale-adaptive Modification of DNA Nanostructures IEEE Transactions on Visualization and Computer Graphics, 24(1), January 2018. [  paper] paper] |
Journal Paper with Conference Talk |
| Kai Lawonn, Ivan Viola, Bernhard Preim, Tobias Isenberg A Survey of Surface-Based Illustrative Rendering for Visualization Computer Graphics Forum, (NN), 2018. |
Journal Paper (without talk) | |
| 2017 | ||
| Haichao Miao Visual Abstraction and Modeling in DNA Nanotechnology, 14. December 2017, King Abdullah University of Science and Technology, Saudi Arabia |
Invited Talk | |
 |
Ivan Viola, Tobias Isenberg Pondering the Concept of Abstraction in (Illustrative) Visualization IEEE Transactions on Visualization and Computer Graphics, (99), September 2017. |
Journal Paper with Conference Talk |
 |
Haichao Miao Visualization and Modeling in DNA Nanotechnology, April 2017, Inria, Grenoble, France |
Invited Talk |