Graph-typed data is ubiquitous, from logistical or transportation networks, through social or correspondence networks, all the way to more abstract biochemical interaction networks. Each such application domain brings with it unique analytical goals, metadata, canonical representations, as well as types of vertices and edges. Routine, automated analyses of such data, while important, can often not fully support the kind of decision-making or data exploration necessary for more complex and/or larger networks. Here, it is through (interactive) visualization that we can support domain experts in their exploratory and (semi-) confirmatory research endeavors. On the one hand, we can build custom, tailor-made interactive, visual dashboards which directly address the needs and support the analysis of our domain expert collaborators. On the other, we can look at more foundational questions about how to best represent graph-typed data or better understand the factors which negatively/positively affect comprehension.
Publications
| Image | Bib Reference | Publication Type |
|---|---|---|
| 2025 | ||
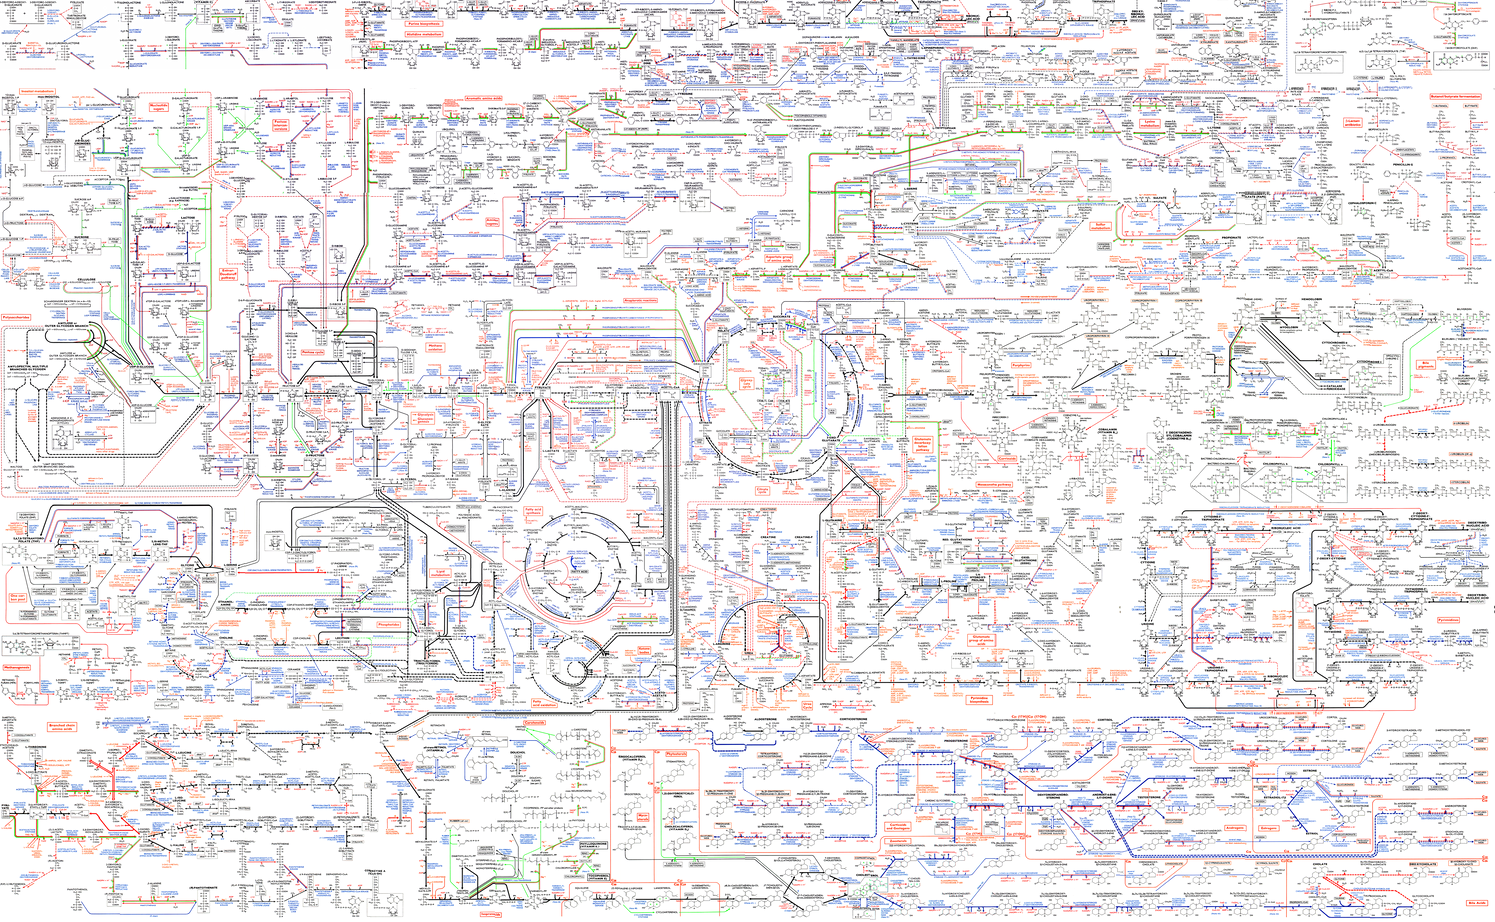
Henry Ehlers , Nicolas Brich, Michael Krone, Martin Nöllenburg, Jiacheng Yu, Hiroaki Natsukawa, Xiaoru Yuan, Hsiang-Yun Wu , Nicolas Brich, Michael Krone, Martin Nöllenburg, Jiacheng Yu, Hiroaki Natsukawa, Xiaoru Yuan, Hsiang-Yun WuAn introduction to and survey of biological network visualization COMPUTERS & GRAPHICS-UK, 126, February 2025. |
Journal Paper (without talk) | |
| 2024 | ||
| Henry Ehlers, Daniel Pahr, Velitchko Filipov, Hsiang-Yun Wu, Renata Georgia Raidou Me! Me! Me! Me! A study and comparison of ego network representations COMPUTERS & GRAPHICS-UK, 125:1-15, December 2024. [  paper] paper] |
Journal Paper (without talk) | |
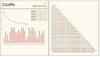 |
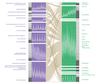
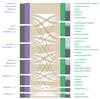
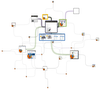
Sebastian Klaus Multidimensional Clustering for Machine Data Analysis [  Bachelor thesis] [ Bachelor thesis] [ image] image] |
Bachelor Thesis |
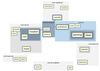
| Henry Ehlers, Diana Marin, Hsiang-Yun Wu, Renata Georgia Raidou Visualizing Group Structure in Compound Graphs: The Current State, Lessons Learned, and Outstanding Opportunities In Proceedings of the 19th International Joint Conference on Computer Vision, Imaging and Computer Graphics Theory and Applications - Volume 1, HUCAPP and IVAPP, pages 697-708. March 2024. |
Conference Paper | |
| 2023 | ||
| Henry Ehlers, Anaïs Villedieu, Renata Georgia Raidou, Hsiang-Yun Wu Improving readability of static, straight-line graph drawings: A first look at edge crossing resolution through iterative vertex splitting COMPUTERS & GRAPHICS-UK, 116:448-463, November 2023. |
Journal Paper (without talk) | |
| 2021 | ||
 |
Johannes Sorger, Alessio Arleo, Peter Kán, Wolfgang Knecht, Manuela Waldner Egocentric Network Exploration for Immersive Analytics Computer Graphics Forum, 40:241-252, October 2021. [  the paper] [ the paper] [ video] [online egocentric network] video] [online egocentric network] |
Journal Paper with Conference Talk |
| 2020 | ||
 |
Manuela Waldner, Daniel Steinböck, Eduard Gröller Interactive exploration of large time-dependent bipartite graphs Journal of Computer Languages, 57, April 2020. [paper] |
Journal Paper (without talk) |
| 2019 | ||
 |
Johannes Sorger, Manuela Waldner, Wolfgang Knecht, Alessio Arleo Immersive Analytics of Large Dynamic Networks via Overview and Detail Navigation In 2nd International Conference on Artificial Intelligence & Virtual Reality, pages 144-151. December 2019. [  video] [arxiv preprint] video] [arxiv preprint] |
Conference Paper |
| 2018 | ||
 |
Daniel Steinböck, Eduard Gröller, Manuela Waldner Casual Visual Exploration of Large Bipartite Graphs Using Hierarchical Aggregation and Filtering In International Symposium on Big Data Visual and Immersive Analytics. October 2018. [  paper] paper] |
Conference Paper |
 |
Michael Mazurek, Manuela Waldner Visualizing Expanded Query Results Computer Graphics Forum:87-98, June 2018. [  paper] [ paper] [ video] video] |
Journal Paper with Conference Talk |
| 2014 | ||
 |
Manuela Waldner, Stefan Bruckner, Ivan Viola Graphical Histories of Information Foraging In Proceedings of the 8th Nordic Conference on Human-Computer Interaction: Fun, Fast, Foundational , pages 295-304. October 2014. [  paper] paper] |
Conference Paper |