

Steffen Oeltze, Helwig Hauser , Johannes Kehrer
IEEE VIS Tutorial on Interactive Visual Analysis of Scientific Data,
October 2013, IEEE VisWeek, Atlanta, Georgia, USA
[ Tutorial proposal]
Information
- Publication Type: WorkshopTalk
- Workgroup(s)/Project(s):
- Date: October 2013
- Event: IEEE VisWeek
- Lecturer:
- Steffen Oeltze
- Helwig Hauser
- Johannes Kehrer
- Location: Atlanta, Georgia, USA
Abstract
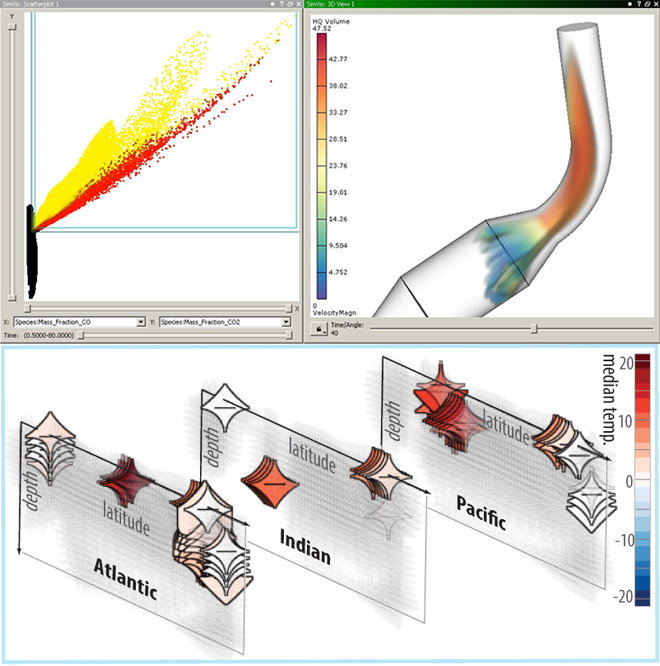
In a growing number of application areas, a subject or phenomenon is investigated by means of multiple datasets being acquired over time (spatiotemporal), comprising several attributes per data point (multi-variate), stemming from different data sources (multi-modal) or multiple simulation runs (multi-run/ensemble). Interactive visual analysis (IVA) comprises concepts and techniques for a user-guided knowledge discovery in such complex data. Through a tight feedback loop of computation, visualization and user interaction, it provides new insight into the data and serves as a vehicle for hypotheses generation or validation. It is often implemented via a multiple coordinated view framework where each view is equipped with interactive drill-down operations for focusing on data features. Two classes of views are integrated: physical views, such as direct volume rendering, show information in the context of the spatiotemporal observation space while attribute views, such as scatter plots and parallel coordinates, show relationships between multiple data attributes. The user may drill-down the data by selecting interesting regions of the observation space or attribute ranges leading to a consistent highlighting of this selection in all other views (brushing-and-linking). Three patterns of explorative/analytical procedures may be accomplished by doing so. In a feature localization, the user searches for places in the 3D/4D observation space where certain attribute values are present. In a multi-variate analysis, relations between data attributes are investigated, e.g., by searching for correla- tions. In a local investigation, the user inspects the values of selected attributes with respect to certain spatiotemporal subsets of the observation space.In this tutorial, we discuss examples for successful applications of IVA to scientific data from various fields: climate research, medicine, epidemiology, and flow simulation / computation, in particular for automotive engineering. We base our discussions on a theoretical foundation of IVA which helps the tutorial attendees in transferring the subject matter to their own data and application area. In the course of the tutorial, the attendees will become acquainted with techniques from statistics and knowledge discovery, which proved to be particularly useful for a specific IVA application. The tutorial further comprises an overview of off-the-shelf IVA solutions, which may be be particularly interesting for visualization practitioners. It is concluded by a summary of the gained knowledge and a discussion of open problems in IVA of scientific data.
The tutorial slides will be available at: http://tinyurl.com/SciDataIVA13
Additional Files and Images

Weblinks
No further information available.BibTeX
@WorkshopTalk{oeltze-2013-tut,
  title =      "IEEE VIS Tutorial on Interactive Visual Analysis of
               Scientific Data",
  author =     "Steffen Oeltze and Helwig Hauser and Johannes Kehrer",
  year =       "2013",
  abstract =   "In a growing number of application areas, a subject or
               phenomenon is investigated by means of multiple datasets
               being acquired over time (spatiotemporal), comprising
               several attributes per data point (multi-variate), stemming
               from different data sources (multi-modal) or multiple
               simulation runs (multi-run/ensemble). Interactive visual
               analysis (IVA) comprises concepts and techniques for a
               user-guided knowledge discovery in such complex data.
               Through a tight feedback loop of computation, visualization
               and user interaction, it provides new insight into the data
               and serves as a vehicle for hypotheses generation or
               validation. It is often implemented via a multiple
               coordinated view framework where each view is equipped with
               interactive drill-down operations for focusing on data
               features. Two classes of views are integrated: physical
               views, such as direct volume rendering, show information in
               the context of the spatiotemporal observation space while
               attribute views, such as scatter plots and parallel
               coordinates, show relationships between multiple data
               attributes. The user may drill-down the data by selecting
               interesting regions of the observation space or attribute
               ranges leading to a consistent highlighting of this
               selection in all other views (brushing-and-linking). Three
               patterns of explorative/analytical procedures may be
               accomplished by doing so. In a feature localization, the
               user searches for places in the 3D/4D observation space
               where certain attribute values are present. In a
               multi-variate analysis, relations between data attributes
               are investigated, e.g., by searching for correla- tions. In
               a local investigation, the user inspects the values of
               selected attributes with respect to certain spatiotemporal
               subsets of the observation space.  In this tutorial, we
               discuss examples for successful applications of IVA to
               scientific data from various fields: climate research,
               medicine, epidemiology, and flow simulation / computation,
               in particular for automotive engineering. We base our
               discussions on a theoretical foundation of IVA which helps
               the tutorial attendees in transferring the subject matter to
               their own data and application area. In the course of the
               tutorial, the attendees will become acquainted with
               techniques from statistics and knowledge discovery, which
               proved to be particularly useful for a specific IVA
               application. The tutorial further comprises an overview of
               off-the-shelf IVA solutions, which may be be particularly
               interesting for visualization practitioners. It is concluded
               by a summary of the gained knowledge and a discussion of
               open problems in IVA of scientific data.  The tutorial
               slides will be available at: http://tinyurl.com/SciDataIVA13",
  month =      oct,
  event =      "IEEE VisWeek",
  location =   "Atlanta, Georgia, USA",
  URL =        "https://www.cg.tuwien.ac.at/research/publications/2013/oeltze-2013-tut/",
}