

Sara Di Bartolomeo , A. Dobler, Velitchko Filipov, Martin Nöllenburg, Henry Ehlers
The Story(line) So Far: A Survey on Storyline Visualization
In EuroVis 2026: 28th Eurographics Conference on Visualization 2026. June 2026.
[ paper]
Information
- Publication Type: Conference Paper
- Workgroup(s)/Project(s): not specified
- Date: June 2026
- Open Access: yes
- Location: Nottingham
- Lecturer: Sara Di Bartolomeo
- Event: 28th Eurographics Conference on Visualization (EuroVis 2026)
- Editor: Abdul-Rahman, Alfie and Angelini, Marco and Preim, Bernhard
- DOI: 10.1111/cgf.70499
- Booktitle: EuroVis 2026: 28th Eurographics Conference on Visualization 2026
- Pages: 30
- Volume: 45/3
- Conference date: 8. June 2026 – 12. June 2026
- Keywords: Storyline Visualization, Dynamic Networks, Visualization, Visual Analytics, Graph Drawing
Abstract
Storyline visualizations model narratives as temporal networks, using x-monotone lines to represent entities and their interactions over time. This technique offers an intuitive way to reveal structural patterns over time, such as character co-occurrence and narrative flow. Storylines represent a visualization approach with growing interest from the visualization community and applications in diverse contexts. Researchers have developed various layout algorithms and formalized a set of optimization objectives with the goal of automating their generation and balancing their readability, graph aesthetics, and efficiency. These methods vary in their algorithmic formulations and implementations as well as the visual elements they support, such as labels, grouping, or continuity preservation across time. This state-of-the-art report maps the current landscape of storyline visualization approaches, with a specific focus on the visual structures, optimization objectives, and the characteristic of the layout algorithms that generate these.Additional Files and Images
Additional images and videos
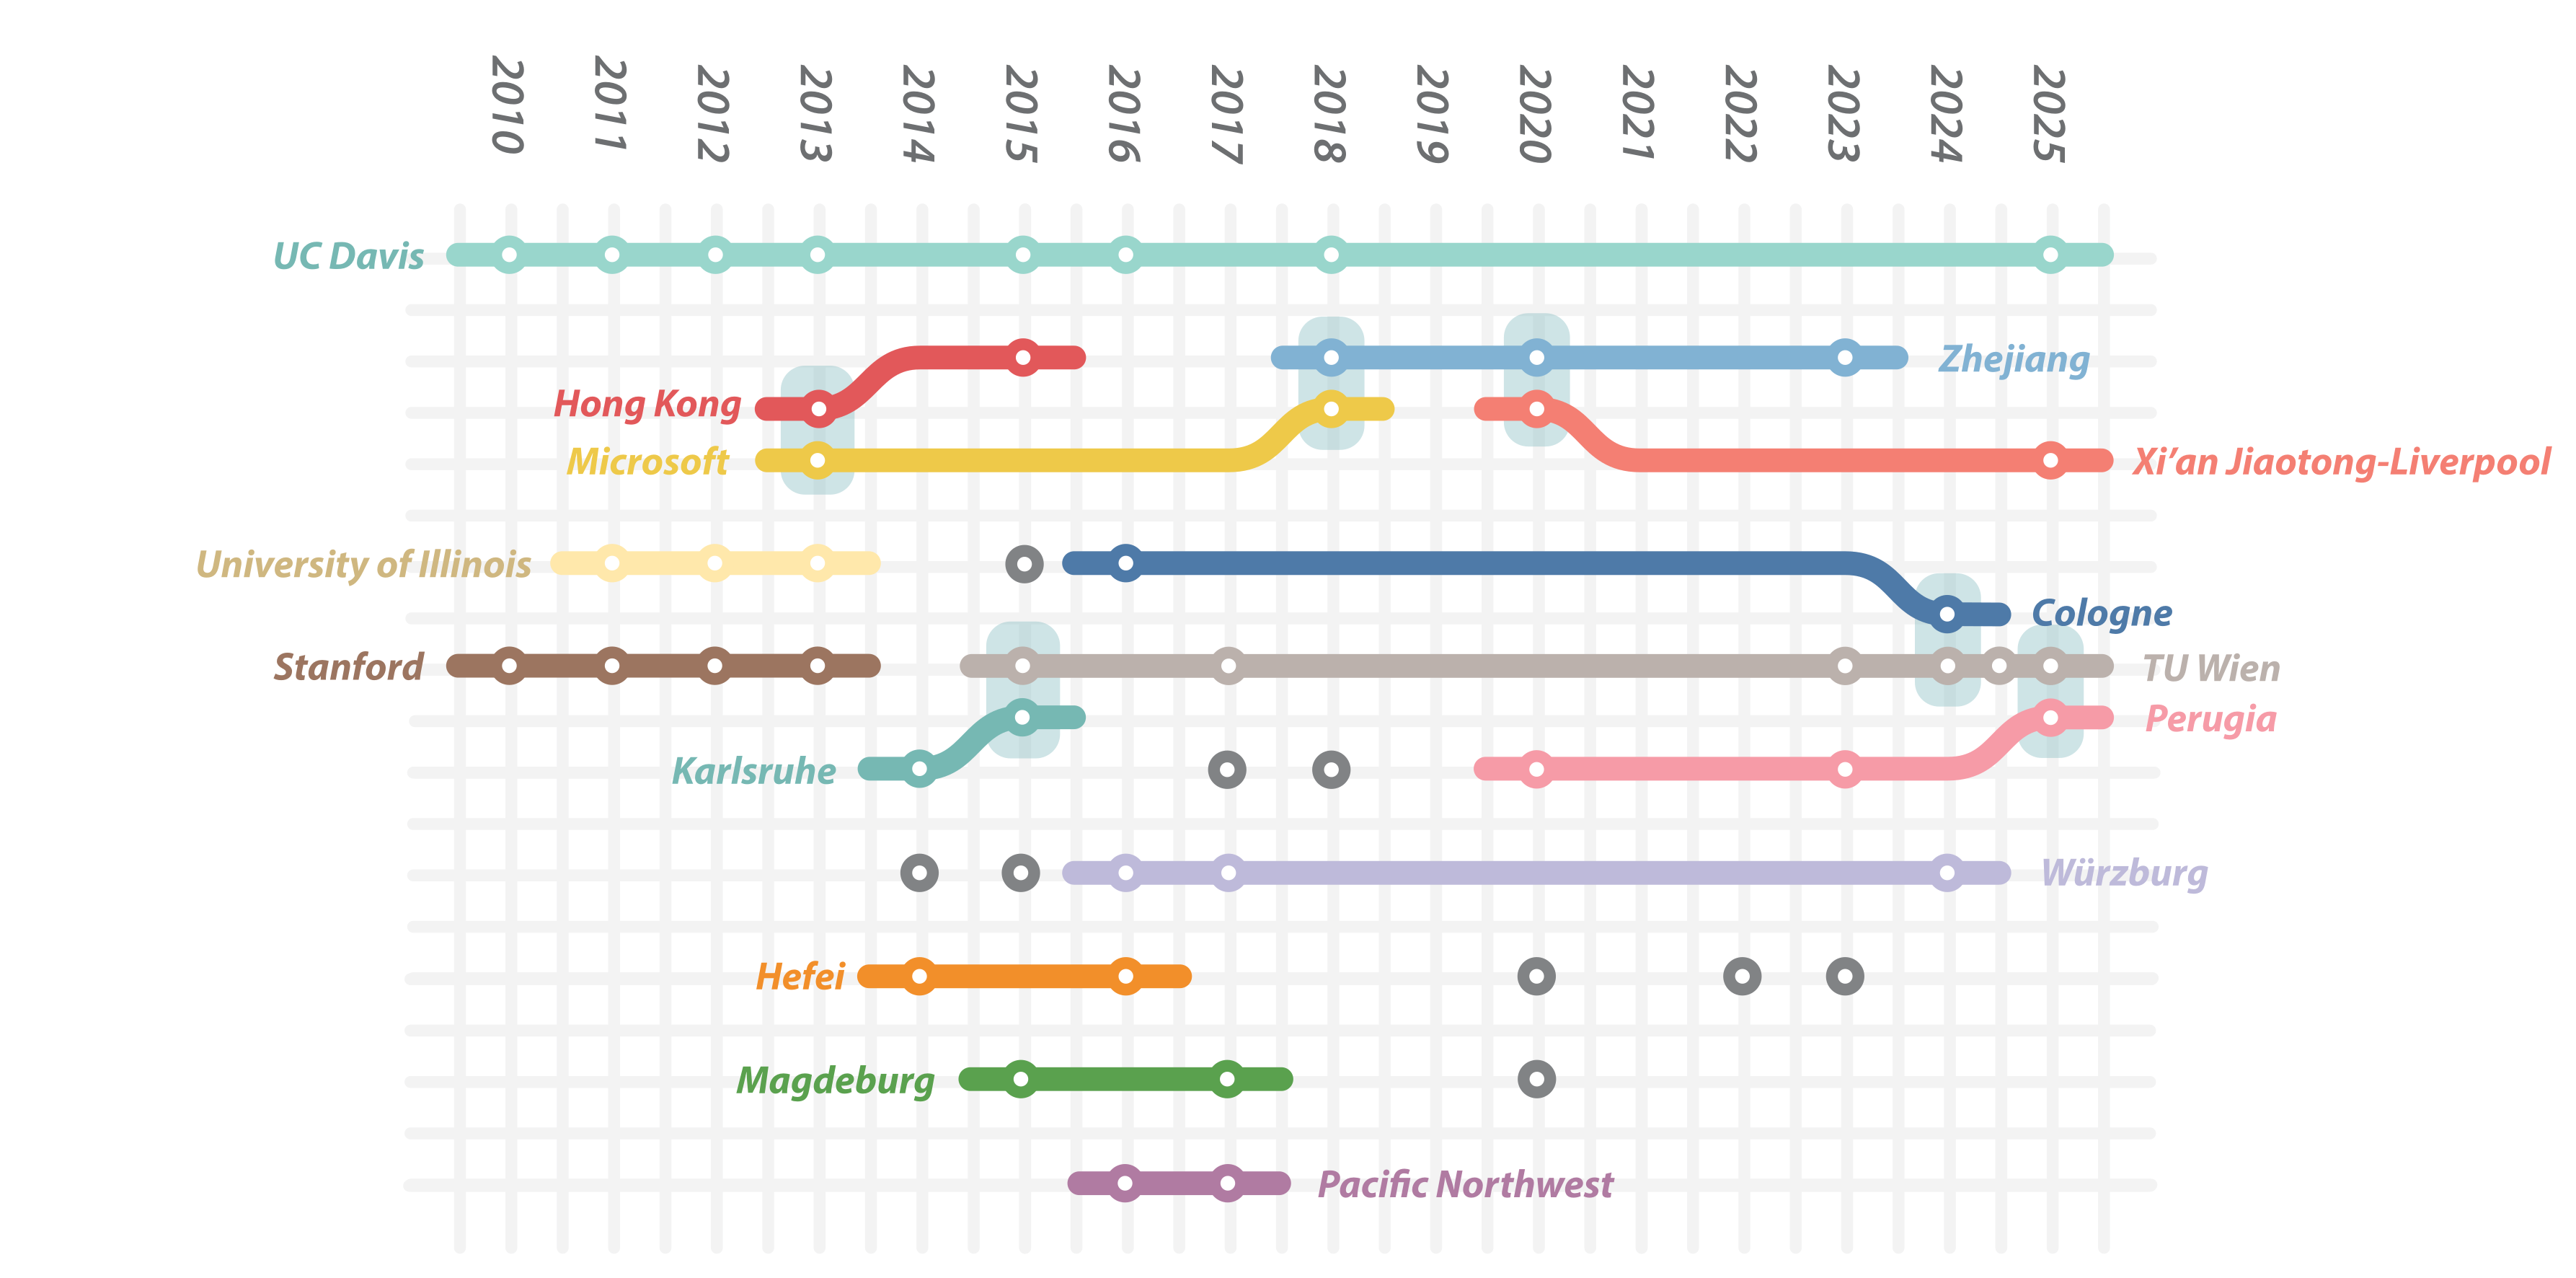
teaser:
A storyline of publications included in this survey over time. Colored dots represent individual papers (“events”). Lines
correspond to institutions that appear in more than one publication, while papers from other institutions are shown as isolated dots.
Collaborations between institutions are indicated by blue rectangles. The visualization highlights a vibrant research field, with recurring
collaborations and a steady stream of publications across years. Note that, in this case in particular, the graph is laid out manually.
Additional files

Weblinks
BibTeX
@inproceedings{di_bartolomeo-2026-tss,
  title =      "The Story(line) So Far: A Survey on Storyline Visualization",
  author =     "Sara Di Bartolomeo and A. Dobler and Velitchko Filipov and
               Martin N\"{o}llenburg and Henry Ehlers",
  year =       "2026",
  abstract =   "Storyline visualizations model narratives as temporal
               networks, using x-monotone lines to represent entities and
               their interactions over time. This technique offers an
               intuitive way to reveal structural patterns over time, such
               as character co-occurrence and narrative flow. Storylines
               represent a visualization approach with growing interest
               from the visualization community and applications in diverse
               contexts. Researchers have developed various layout
               algorithms and formalized a set of optimization objectives
               with the goal of automating their generation and balancing
               their readability, graph aesthetics, and efficiency. These
               methods vary in their algorithmic formulations and
               implementations as well as the visual elements they support,
               such as labels, grouping, or continuity preservation across
               time. This state-of-the-art report maps the current
               landscape of storyline visualization approaches, with a
               specific focus on the visual structures, optimization
               objectives, and the characteristic of the layout algorithms
               that generate these.",
  month =      jun,
  location =   "Nottingham",
  event =      "28th Eurographics Conference on Visualization (EuroVis 2026)",
  editor =     "Abdul-Rahman, Alfie and Angelini, Marco and Preim, Bernhard",
  doi =        "10.1111/cgf.70499",
  booktitle =  "EuroVis 2026: 28th Eurographics Conference on Visualization
               2026",
  pages =      "30",
  volume =     "45/3",
  keywords =   "Storyline Visualization, Dynamic Networks, Visualization,
               Visual Analytics, Graph Drawing",
  URL =        "https://www.cg.tuwien.ac.at/research/publications/2026/di_bartolomeo-2026-tss/",
}