

Niclas Arbesser-Rastburg
Visualizing the Flow of Healthcare Data
[ thesis]
Information
- Publication Type: Bachelor Thesis
- Workgroup(s)/Project(s):
- Date: June 2023
- Date (Start): November 2022
- Date (End): June 2023
- Matrikelnummer: 01625725
- First Supervisor: Manuela Waldner

Abstract
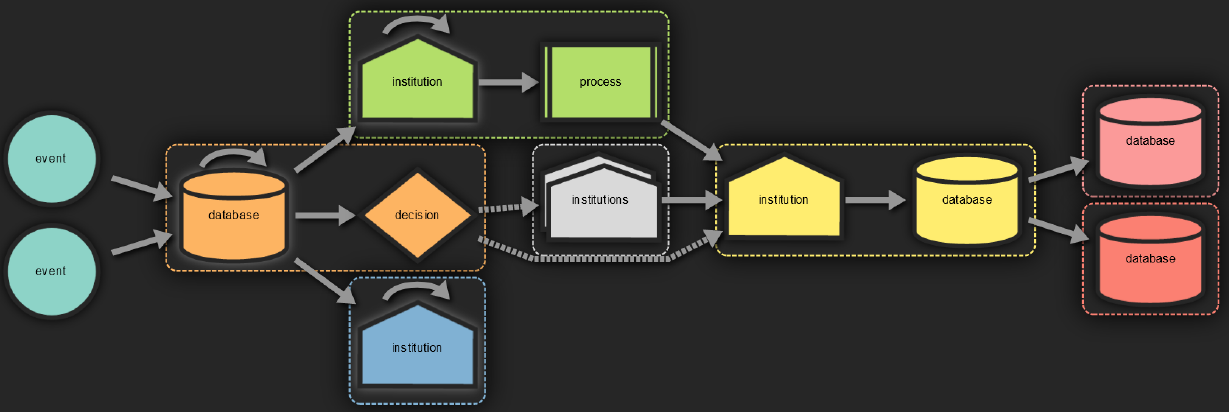
The flow of medical data in a modern and interconnected society between large numbers of stakeholders and institutions forms an intricate network. Due to size and complexity, this network is hard to traverse for anyone wishing to gain insight into where their medical data ends up. Visualisation can be used as a powerful tool, in order to make this flow of data more accessible and easier to understand for experts and everyday people, increasing transparency and readability. This work aims to explore ways to visualise parts of this network and provide a framework that visualises the connections between the different stakeholders in it and the data they exchange. The implementation will be done as a web application which provides interactivity to improve user experience. This interactivity will implement the visual information-seeking mantra, by giving an overview first and allowing zooming, filtering and showing details on demand. Whether the set requirements were met will be determined by gathering feedback from expert users about their experience in using the application.Additional Files and Images

Weblinks
No further information available.BibTeX
@bachelorsthesis{arbesser_ba_2023,
  title =      "Visualizing the Flow of Healthcare Data",
  author =     "Niclas Arbesser-Rastburg",
  year =       "2023",
  abstract =   "The flow of medical data in a modern and interconnected
               society between large numbers of stakeholders and
               institutions forms an intricate network. Due to size and
               complexity, this network is hard to traverse for anyone
               wishing to gain insight into where their medical data ends
               up. Visualisation can be used as a powerful tool, in order
               to make this flow of data more accessible and easier to
               understand for experts and everyday people, increasing
               transparency and readability. This work aims to explore ways
               to visualise parts of this network and provide a framework
               that visualises the connections between the different
               stakeholders in it and the data they exchange. The
               implementation will be done as a web application which
               provides interactivity to improve user experience. This
               interactivity will implement the visual information-seeking
               mantra, by giving an overview first and allowing zooming,
               filtering and showing details on demand. Whether the set
               requirements were met will be determined by gathering
               feedback from expert users about their experience in using
               the application.",
  month =      jun,
  address =    "Favoritenstrasse 9-11/E193-02, A-1040 Vienna, Austria",
  school =     "Research Unit of Computer Graphics, Institute of Visual
               Computing and Human-Centered Technology, Faculty of
               Informatics, TU Wien ",
  URL =        "https://www.cg.tuwien.ac.at/research/publications/2023/arbesser_ba_2023/",
}