

Daniel Lippeck
3D Graph Algorithm for Multilayer Network Analytics
[ thesis]
Information
- Publication Type: Bachelor Thesis
- Workgroup(s)/Project(s):
- Date: April 2022
- Date (Start): 2021
- Date (End): April 2022
- Matrikelnummer: 11776883
- First Supervisor:

Abstract
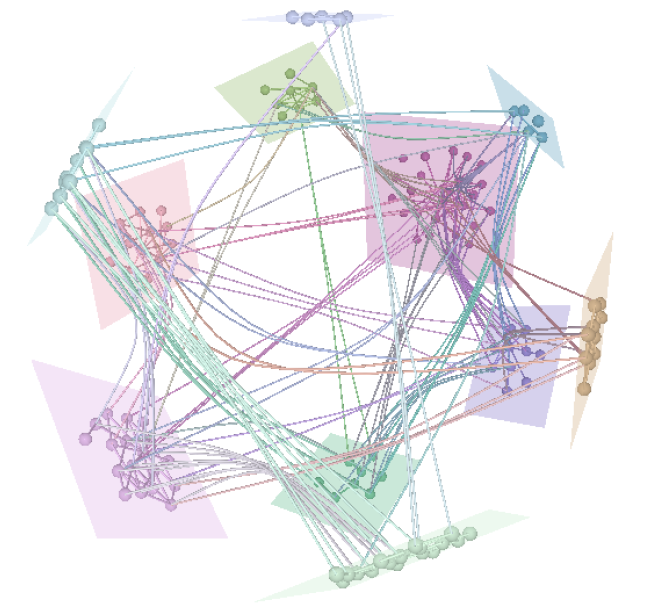
Simple graphs are often not able to accurately represent real world entities. Therefore, more complex data structures have been introduced, one of which is the so-called “multilayer network”. Multilayer networks are used in multiple fields, such as medical science, where data can represent the correlation of diseases or social science, where data might represent different actors and their relationship to one another.Visualizing these complex data types is particularly challenging, as two-dimensional visualizations - the gold standard for graph visualizations - are often not good enough to gather deeper insight into the data, as big datasets quickly fill two-dimensional visualizations with visual clutter. Therefore, this thesis introduces a new visualization technique for multilayer networks by extending existing 2d state-of-the-art methods with a third dimensions.
Our solution visualizes the layers as sub graphs on a two-dimensional plane, which are positioned around a sphere. To optimize the layout within the layer for multilayer networks, our solution calculates the position of individual nodes by considering connections within the same layer, as well as connections to other layers. To minimize visual clutter, edge bundling was implemented, additionally to a view, which restricts the visualization to nodes and edges of a single layer, as well as connections to nodes of other layers. Our results show that our solution with the additional space due to the third dimension, combined with an optimized layout, allows users to visualize larger networks and gather better insight into the data, compared to conventional two-dimensional
Additional Files and Images

Weblinks
No further information available.BibTeX
@bachelorsthesis{lippeck-2022-mna,
  title =      "3D Graph Algorithm for Multilayer Network Analytics",
  author =     "Daniel Lippeck",
  year =       "2022",
  abstract =   "Simple graphs are often not able to accurately represent
               real world entities. Therefore, more complex data structures
               have been introduced, one of which is the so-called
               “multilayer network”. Multilayer networks are used in
               multiple fields, such as medical science, where data can
               represent the correlation of diseases or social science,
               where data might represent different actors and their
               relationship to one another.  Visualizing these complex data
               types is particularly challenging, as two-dimensional
               visualizations - the gold standard for graph visualizations
               - are often not good enough to gather deeper insight into
               the data, as big datasets quickly fill two-dimensional
               visualizations with visual clutter. Therefore, this thesis
               introduces a new visualization technique for multilayer
               networks by extending existing 2d state-of-the-art methods
               with a third dimensions.  Our solution visualizes the layers
               as sub graphs on a two-dimensional plane, which are
               positioned around a sphere. To optimize the layout within
               the layer for multilayer networks, our solution calculates
               the position of individual nodes by considering connections
               within the same layer, as well as connections to other
               layers. To minimize visual clutter, edge bundling was
               implemented, additionally to a view, which restricts the
               visualization to nodes and edges of a single layer, as well
               as connections to nodes of other layers. Our results show
               that our solution with the additional space due to the third
               dimension, combined with an optimized layout, allows users
               to visualize larger networks and gather better insight into
               the data, compared to conventional two-dimensional",
  month =      apr,
  address =    "Favoritenstrasse 9-11/E193-02, A-1040 Vienna, Austria",
  school =     "Research Unit of Computer Graphics, Institute of Visual
               Computing and Human-Centered Technology, Faculty of
               Informatics, TU Wien ",
  URL =        "https://www.cg.tuwien.ac.at/research/publications/2022/lippeck-2022-mna/",
}