

Christoph Michael Essler
Interactive Web-Based Flood Map Visualization
[ Bachelor thesis]
Information
- Publication Type: Bachelor Thesis
- Workgroup(s)/Project(s):
- Date: December 2022
- Date (Start): 5. July 2022
- Date (End): 8. December 2022
- Matrikelnummer: 01328166
- First Supervisor: Eduard Gröller

Abstract
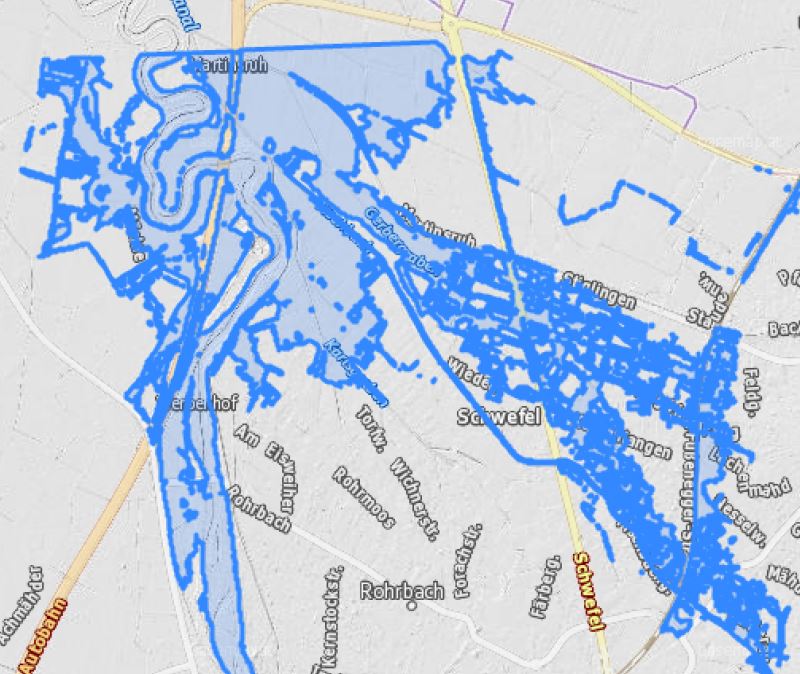
Floods cause many deaths as well as lots of financial damage. Flood maps encode areas susceptibility for floods and can be used in several ways that reduce loss from floods - they are already in use for determining in which areas it is safe to build new buildings. Making them available online might increase public awareness of the risks associated with floods in specific areas. Additionally, maps are easier to reach once they are available on the internet. In the course of this thesis, the current status quo concerning available online flood maps is determined by research, and a React-based web map component to visualize flood maps was developed for the web client of a flood simulation and visualization system. The map represents floods by polygons. The vertices of the polygons are provided by the simulation system, and are then rendered over the map on the web client. In the future, the developed component could include further interactivity that allows more correspondence with the simulation system, so that it could edit the simulations.Additional Files and Images

Weblinks
No further information available.BibTeX
@bachelorsthesis{Essler2022,
  title =      "Interactive Web-Based Flood Map Visualization",
  author =     "Christoph Michael  Essler",
  year =       "2022",
  abstract =   "Floods cause many deaths as well as lots of financial
               damage. Flood maps encode areas susceptibility for floods
               and can be used in several ways that reduce loss from floods
               - they are already in use for determining in which areas it
               is safe to build new buildings. Making them available online
               might increase public awareness of the risks associated with
               floods in specific areas. Additionally, maps are easier to
               reach once they are available on the internet. In the course
               of this thesis, the current status quo concerning available
               online flood maps is determined by research, and a
               React-based web map component to visualize flood maps was
               developed for the web client of a flood simulation and
               visualization system. The map represents floods by polygons.
               The vertices of the polygons are provided by the simulation
               system, and are then rendered over the map on the web
               client. In the future, the developed component could include
               further interactivity that allows more correspondence with
               the simulation system, so that it could edit the
               simulations.",
  month =      dec,
  address =    "Favoritenstrasse 9-11/E193-02, A-1040 Vienna, Austria",
  school =     "Research Unit of Computer Graphics, Institute of Visual
               Computing and Human-Centered Technology, Faculty of
               Informatics, TU Wien ",
  URL =        "https://www.cg.tuwien.ac.at/research/publications/2022/Essler2022/",
}