

Dominik Scholz
A Modular Domain-Specific Language for Interactive 3D Visualization
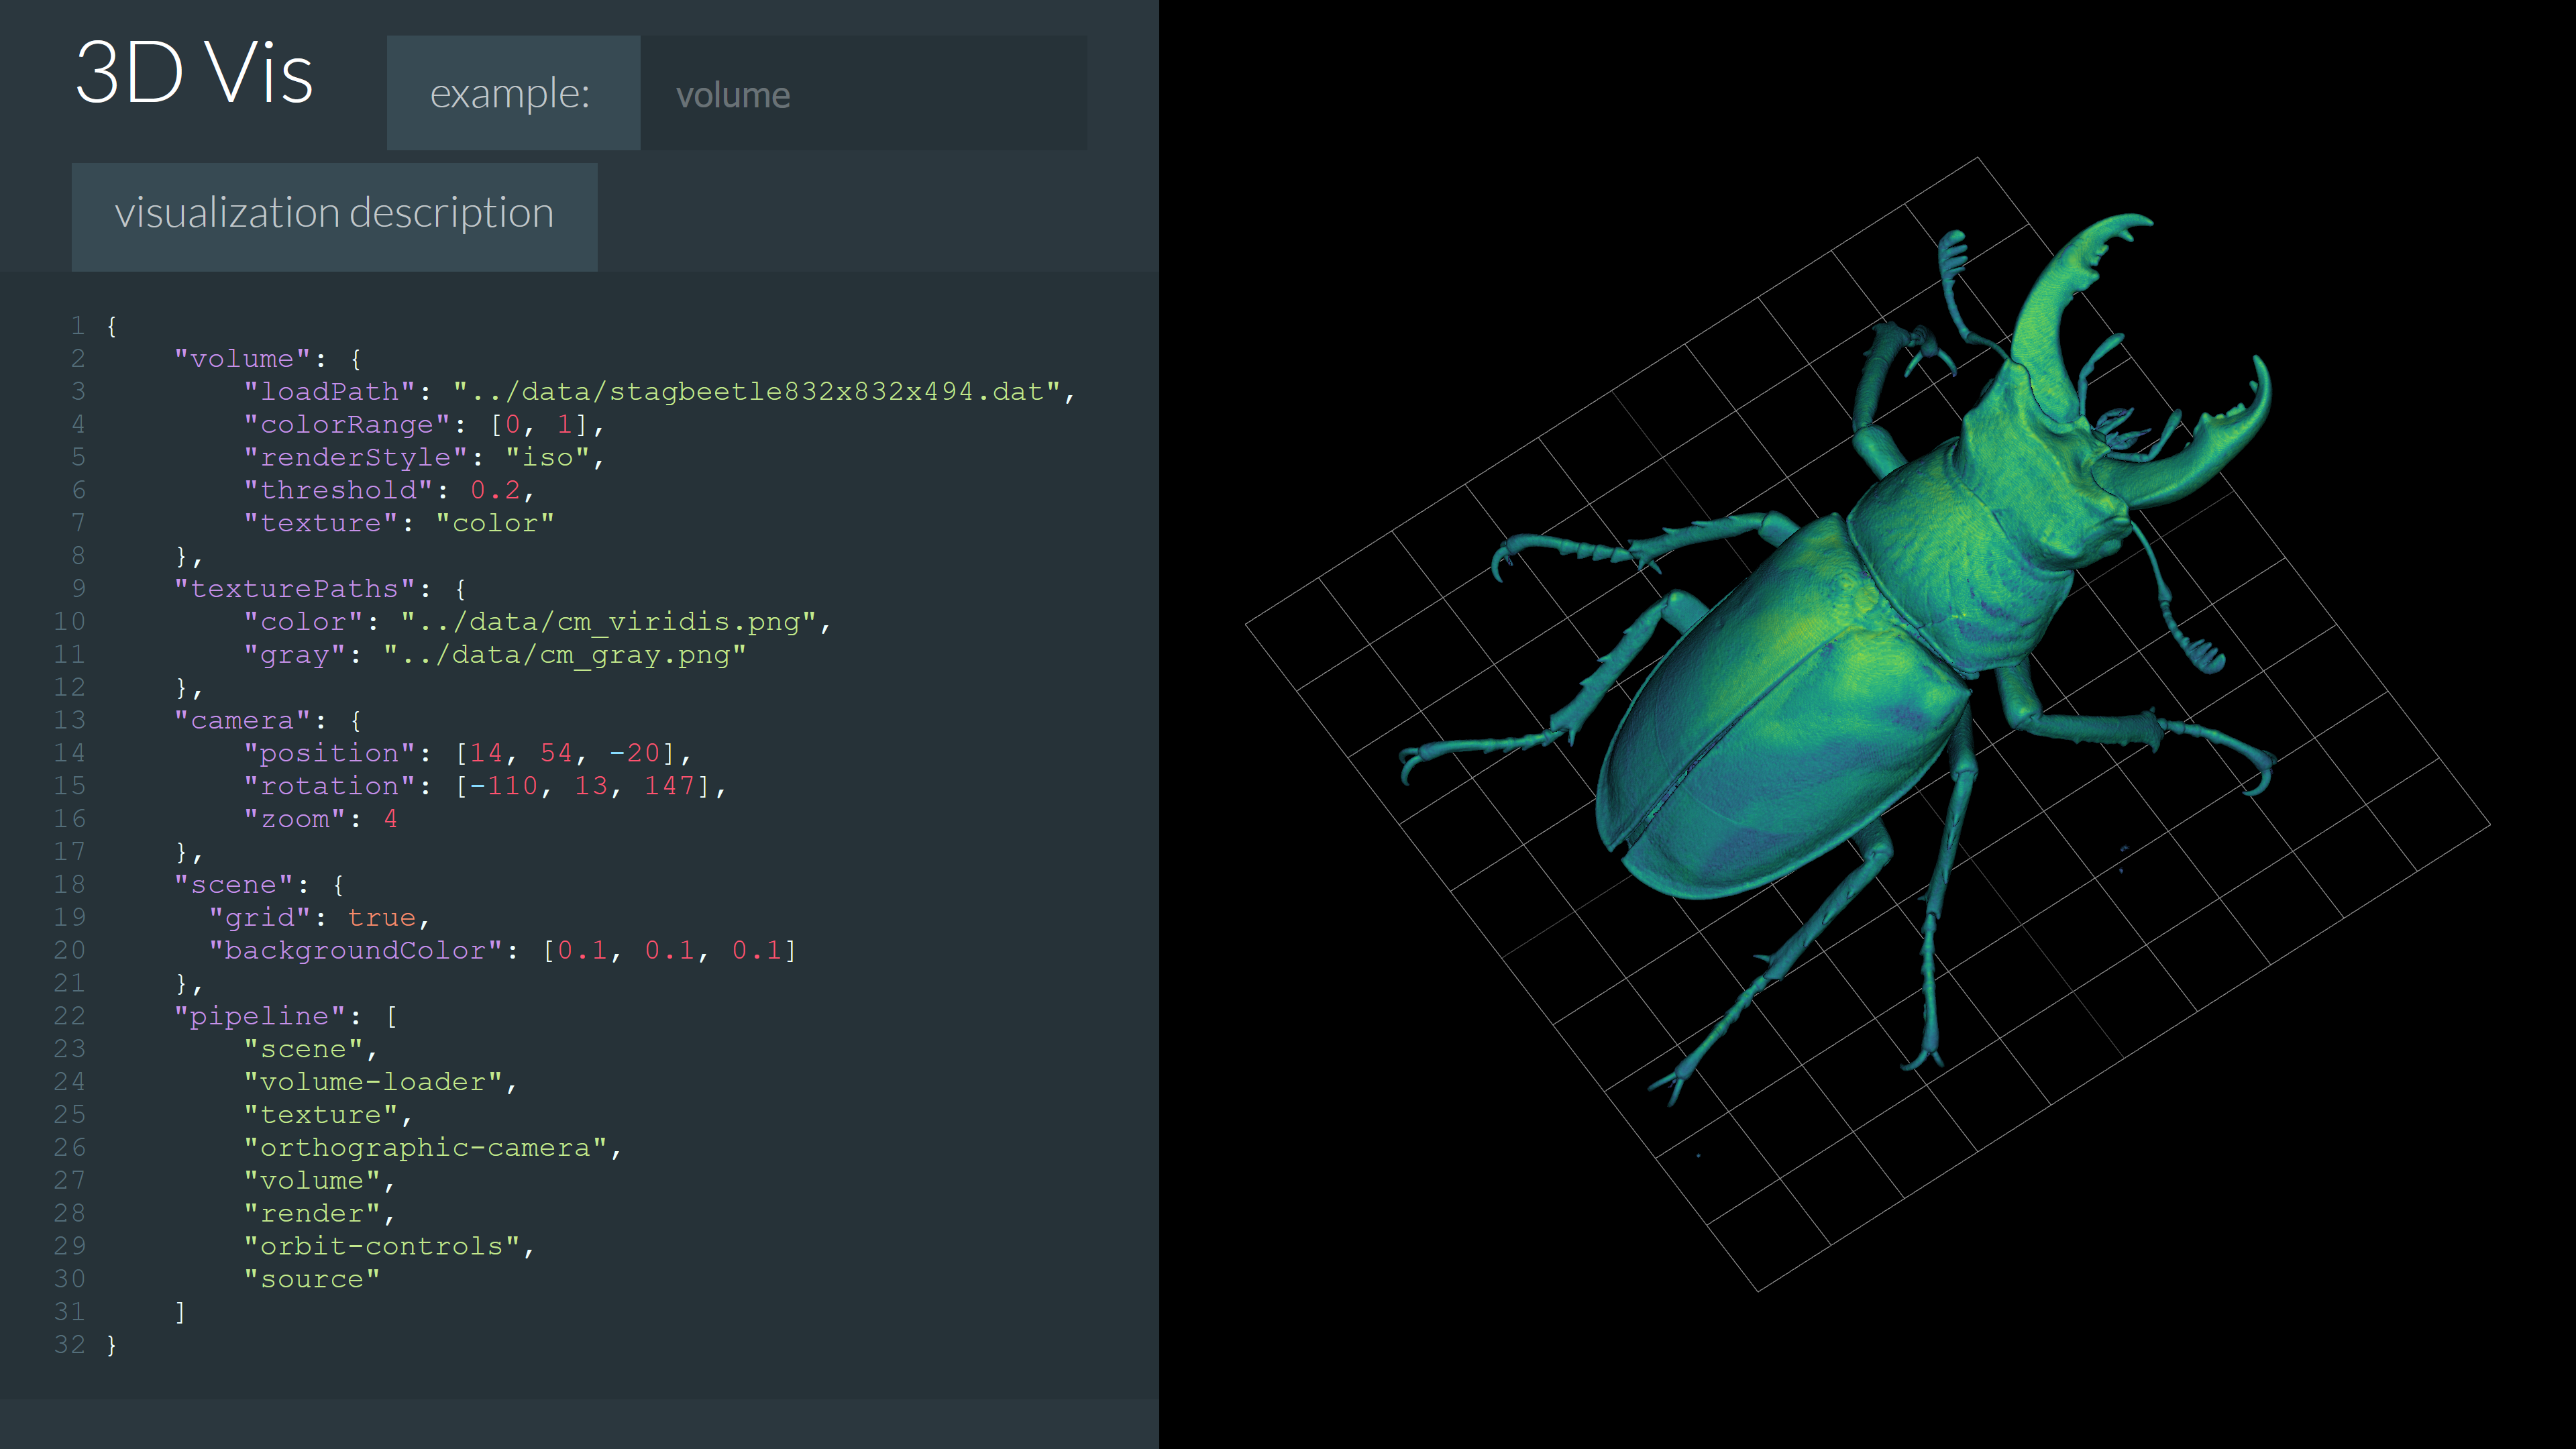
[image] [ Master Thesis] [
 Poster]
Information
- Publication Type: Master Thesis
- Workgroup(s)/Project(s):
- Date: May 2021
- Date (Start): 10. July 2020
- Date (End): 10. May 2021
- TU Wien Library:
- Second Supervisor: Harald Steinlechner
- Diploma Examination: 10. May 2021
- Open Access: yes
- First Supervisor: Eduard Gröller

- Pages: 104
- Keywords: DSL, visualization
Abstract
Visualizing data is an integral part of many scientific disciplines. Due to the complexity of 3D visualizations, their creation usually requires visualization experts. This thesis proposes a system for specifying visualizations without requiring in-depth knowledge about computer graphics. Instead, visualizations are defined in a domain-specific language. This language enables users to easily create and edit 3D visualizations on their own. The language provides configuration capabilities for all aspects of the visualization pipeline, ranging from data transformation up to rendering. Configuring the visualization pipeline is facilitated through a versatile extension mechanism, allowing the definition of modules. Pre-defined modules provide a wide range of 3D visualization techniques, such as volumes or point clouds. Additionally, users can create new modules to support other visualization techniques. Our visualization description is a declarative language specified in a human-readable text format. Due to this format, visualizations created with our language are simple to store and share. Using a text-based format is a natural method for communicating information over the web. Hence, it makes our visualization description easily transferable. Interactivity is another crucial aspect of 3D visualization that our language supports. User events emit messages that the visualization can then use to modify itself. The message system also makes it possible to visualize dynamic data. Modifications of the visualizations pass through our system to automatically analyze the changes. Then just the needed subset of rendering calls to achieve the change execute. With this approach, GPU resources like shaders, buffers, and textures only update when required. This strategy enhances rendering performance and hides implementation detail from the user making the system easier approachable.Additional Files and Images


Weblinks
BibTeX
@mastersthesis{scholz_2021,
  title =      "A Modular Domain-Specific Language for Interactive 3D
               Visualization ",
  author =     "Dominik Scholz",
  year =       "2021",
  abstract =   "Visualizing data is an integral part of many scientific
               disciplines. Due to the complexity of 3D visualizations,
               their creation usually requires visualization experts. This
               thesis proposes a system for specifying visualizations
               without requiring in-depth knowledge about computer
               graphics. Instead, visualizations are defined in a
               domain-specific language. This language enables users to
               easily create and edit 3D visualizations on their own. The
               language provides configuration capabilities for all aspects
               of the visualization pipeline, ranging from data
               transformation up to rendering. Configuring the
               visualization pipeline is facilitated through a versatile
               extension mechanism, allowing the definition of modules.
               Pre-defined modules provide a wide range of 3D visualization
               techniques, such as volumes or point clouds. Additionally,
               users can create new modules to support other visualization
               techniques. Our visualization description is a declarative
               language specified in a human-readable text format. Due to
               this format, visualizations created with our language are
               simple to store and share. Using a text-based format is a
               natural method for communicating information over the web.
               Hence, it makes our visualization description easily
               transferable. Interactivity is another crucial aspect of 3D
               visualization that our language supports. User events emit
               messages that the visualization can then use to modify
               itself. The message system also makes it possible to
               visualize dynamic data. Modifications of the visualizations
               pass through our system to automatically analyze the
               changes. Then just the needed subset of rendering calls to
               achieve the change execute. With this approach, GPU
               resources like shaders, buffers, and textures only update
               when required. This strategy enhances rendering performance
               and hides implementation detail from the user making the
               system easier approachable. ",
  month =      may,
  pages =      "104",
  address =    "Favoritenstrasse 9-11/E193-02, A-1040 Vienna, Austria",
  school =     "Research Unit of Computer Graphics, Institute of Visual
               Computing and Human-Centered Technology, Faculty of
               Informatics, TU Wien",
  keywords =   "DSL, visualization",
  URL =        "https://www.cg.tuwien.ac.at/research/publications/2021/scholz_2021/",
}