

Tobias Batik, Soeren Nickel, Martin Nöllenburg, Yu-Shuen Wang, Hsiang-Yun Wu
Mixed Metro Maps with User-Specied Motifs
Poster shown at 29th International Symposium on Graph Drawing and Network Visualization
(14. September 2021-17. September 2021)
Information
- Publication Type: Poster
- Workgroup(s)/Project(s): not specified
- Date: September 2021
- Location: Tübingen
- Event: 29th International Symposium on Graph Drawing and Network Visualization
- Call for Papers: Call for Paper
- Pages: 4
- Conference date: 14. September 2021 – 17. September 2021
- Pages: 1 – 4
Abstract
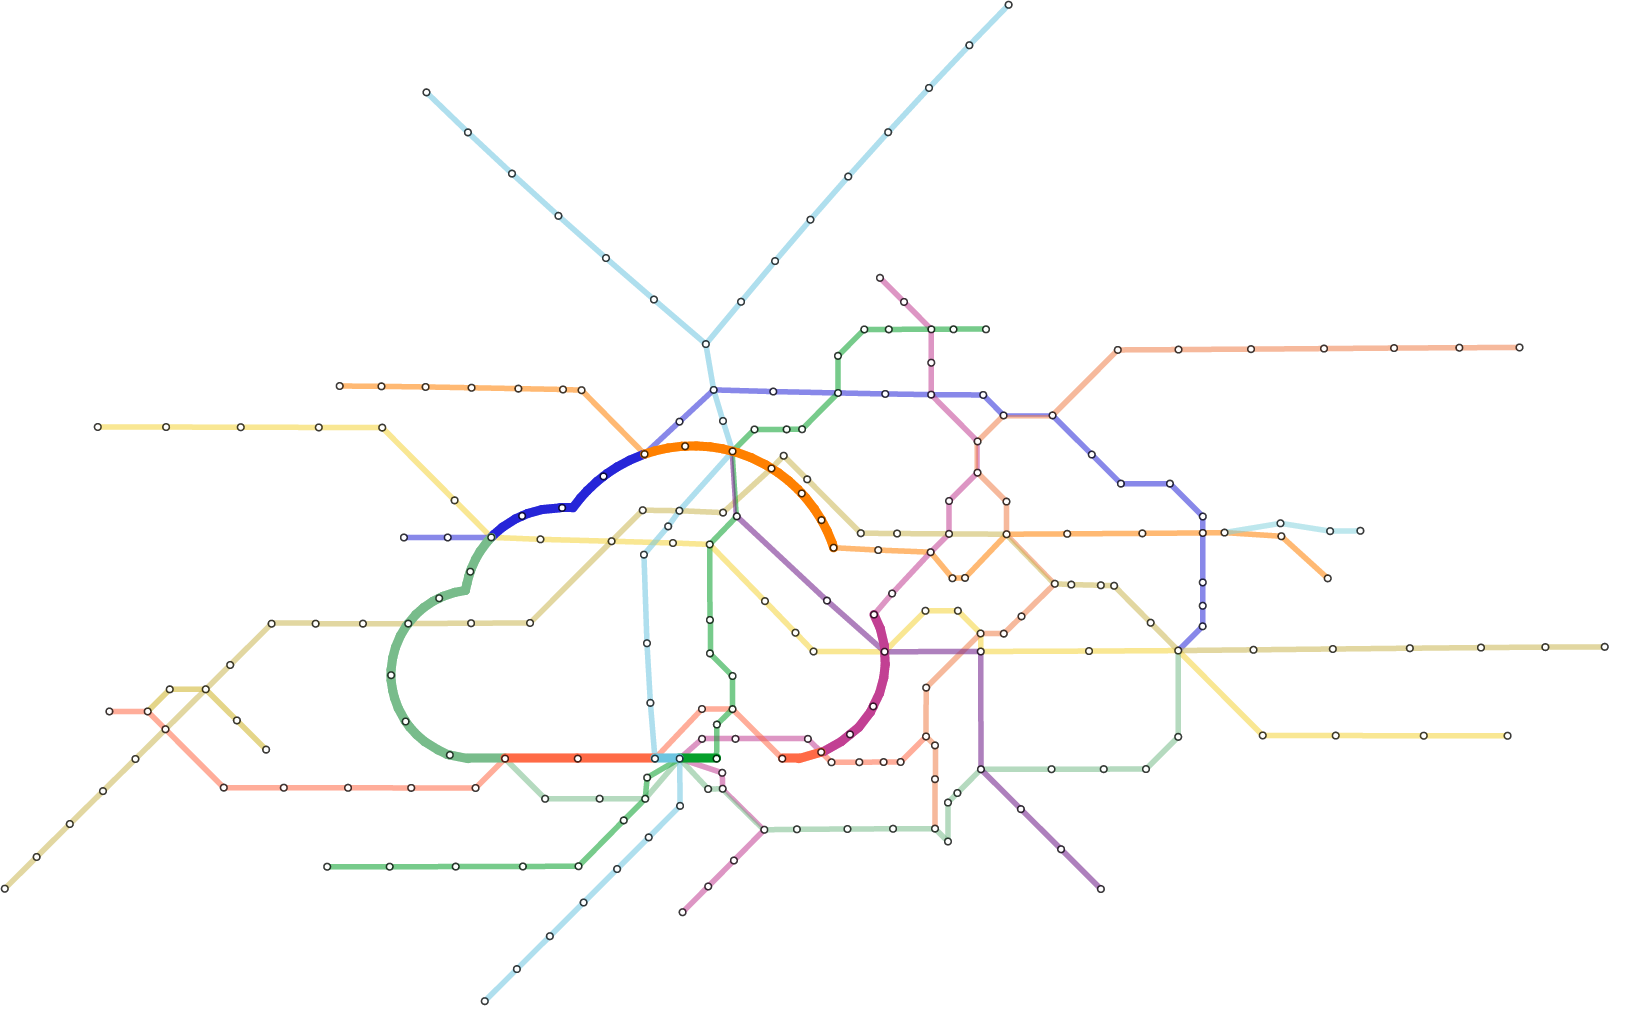
In this poster, we propose an approach to generalize mixed metro map layouts with user-defined shapes for route-finding and ad-vertisement purposes. In a mixed layout, specific lines are arranged in an iconic shape, and the remaining are in octilinear styles. The shape is expected to be recognizable, while the layout still fulfilling the classical octilinear design criteria for metro maps. The approach is in three steps, where we first search for the best fitting edge segment that approximates the guide shape and utilize least squares optimization to synthesize the layout automatically.Additional Files and Images

Weblinks
BibTeX
@misc{batik-2021-gd,
  title =      "Mixed Metro Maps with User-Specied Motifs",
  author =     "Tobias Batik and Soeren Nickel and Martin N\"{o}llenburg and
               Yu-Shuen Wang and Hsiang-Yun Wu",
  year =       "2021",
  abstract =   "In this poster, we propose an approach to generalize mixed
               metro map layouts with user-defined shapes for
               route-finding and ad-vertisement purposes. In a mixed
               layout, specific lines are arranged in an iconic shape, and
               the remaining are in octilinear styles. The shape is
               expected to be recognizable, while the layout still
               fulfilling the classical octilinear design criteria for
               metro maps. The approach is in three steps, where we first
               search for the best fitting edge segment that approximates
               the guide shape and utilize least squares optimization to
               synthesize the layout automatically.",
  month =      sep,
  location =   "T\"{u}bingen",
  event =      "29th International Symposium on Graph Drawing and Network
               Visualization",
  pages =      "4",
  Conference date = "Poster presented at 29th International Symposium on Graph
               Drawing and Network Visualization (2021-09-14--2021-09-17)",
  note =       "1--4",
  pages =      "1 – 4",
  URL =        "https://www.cg.tuwien.ac.at/research/publications/2021/batik-2021-gd/",
}