

Quiong Zeng, Yinqiao Zhao, Teng Zhang, Yi Ciao, Changhe TU, Ivan Viola , Yunhai Wang
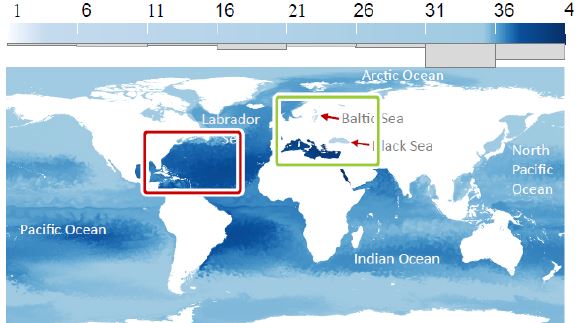
Data-Driven Colormap Adjustment for Exploring Spatial Variations in Scalar Fields
IEEE Transactions on Visualization and Computer Graphics, 9:1-15, September 2021. [Image] [ Paper]
Information
- Publication Type: Journal Paper (without talk)
- Workgroup(s)/Project(s):
- Date: September 2021
- DOI: 10.1109/TVCG.2021.3109014
- Journal: IEEE Transactions on Visualization and Computer Graphics
- Open Access: yes
- Volume: 9
- Pages: 1 – 15
Abstract
Colormapping is an effective and popular visualization technique for analyzing patterns in scalar fields. Scientists usually adjust a default colormap to show hidden patterns by shifting the colors in a trial-and-error process. To improve efficiency, efforts have been made to automate the colormap adjustment process based on data properties (e.g., statistical data value or distribution). However, as the data properties have no direct correlation to the spatial variations, previous methods may be insufficient to reveal the dynamic range of spatial variations hidden in the data. To address the above issues, we conduct a pilot analysis with domain experts and summarize three requirements for the colormap adjustment process. Based on the requirements, we formulate colormap adjustment as an objective function, composed of a boundary term and a fidelity term, which is flexible enough to support interactive functionalities. We compare our approach with alternative methods under a quantitative measure and a qualitative user study (25 participants), based on a set of data with broad distribution diversity. We further evaluate our approach via three case studies with six domain experts. Our method is not necessarily more optimal than alternative methods of revealing patterns, but rather is an additional color adjustment option for exploring data with a dynamic range of spatial variations.Additional Files and Images

Weblinks
BibTeX
@article{Zeng_2021,
  title =      "Data-Driven Colormap Adjustment for Exploring Spatial
               Variations in Scalar Fields",
  author =     "Quiong Zeng and Yinqiao Zhao and Teng  Zhang and Yi Ciao and
               Changhe TU and Ivan Viola and Yunhai Wang",
  year =       "2021",
  abstract =   "Colormapping is an effective and popular visualization
               technique for analyzing patterns in scalar fields.
               Scientists usually adjust a default colormap to show hidden
               patterns by shifting the colors in a trial-and-error
               process. To improve efficiency, efforts have been made to
               automate the colormap adjustment process based on data
               properties (e.g., statistical data value or distribution).
               However, as the data properties have no direct correlation
               to the spatial variations, previous methods may be
               insufficient to reveal the dynamic range of spatial
               variations hidden in the data. To address the above issues,
               we conduct a pilot analysis with domain experts and
               summarize three requirements for the colormap adjustment
               process. Based on the requirements, we formulate colormap
               adjustment as an objective function, composed of a boundary
               term and a fidelity term, which is flexible enough to
               support interactive functionalities. We compare our approach
               with alternative methods under a quantitative measure and a
               qualitative user study (25 participants), based on a set of
               data with broad distribution diversity. We further evaluate
               our approach via three case studies with six domain experts.
               Our method is not necessarily more optimal than alternative
               methods of revealing patterns, but rather is an additional
               color adjustment option for exploring data with a dynamic
               range of spatial variations.",
  month =      sep,
  doi =        "10.1109/TVCG.2021.3109014",
  journal =    "IEEE Transactions on Visualization and Computer Graphics",
  volume =     "9",
  pages =      "1--15",
  URL =        "https://www.cg.tuwien.ac.at/research/publications/2021/Zeng_2021/",
}