

Sarkis Halladjian, David Kouřil , Haichao Miao, Eduard Gröller, Ivan Viola, Tobias Isenberg
Multiscale Unfolding: Illustratively Visualizing the Whole Genome at a Glance
IEEE TRANSACTIONS ON VISUALIZATION AND COMPUTER GRAPHICS , 3:1-13, March 2021. [Image] [ Paper]
Information
- Publication Type: Journal Paper (without talk)
- Workgroup(s)/Project(s):
- Date: March 2021
- DOI: 10.1109/TVCG.2021.3065443
- Journal: IEEE TRANSACTIONS ON VISUALIZATION AND COMPUTER GRAPHICS
- Open Access: yes
- Volume: 3
- Pages: 1 – 13
Abstract
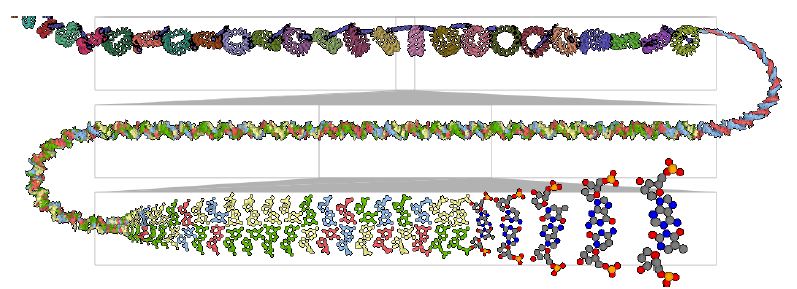
We present Multiscale Unfolding, an interactive technique for illustratively visualizing multiple hierarchical scales of DNA in a single view, showing the genome at different scales and demonstrating how one scale spatially folds into the next. The DNA’s extremely long sequential structure—arranged differently on several distinct scale levels—is often lost in traditional 3D depictions, mainly due to its multiple levels of dense spatial packing and the resulting occlusion. Furthermore, interactive exploration of this complex structure is cumbersome, requiring visibility management like cut-aways. In contrast to existing temporally controlled multiscale data exploration, we allow viewers to always see and interact with any of the involved scales. For this purpose we separate the depiction into constant-scale and scale transition zones. Constant-scale zones maintain a single-scale representation, while still linearly unfolding the DNA. Inspired by illustration, scale transition zones connect adjacent constant-scale zones via level unfolding, scaling, and transparency. We thus represent the spatial structure of the whole DNA macro-molecule, maintain its local organizational characteristics, linearize its higher-level organization, and use spatially controlled, understandable interpolation between neighboring scales. We also contribute interaction techniques that provide viewers with a coarse-to-fine control for navigating within our all-scales-in-one-view representations and visual aids to illustrate the size differences. Overall, Multiscale Unfolding allows viewers to grasp the DNA’s structural composition from chromosomes to the atoms, with increasing levels of “unfoldedness,” and can be applied in data-driven illustration and communication.Additional Files and Images

Weblinks
BibTeX
@article{Sarkis_2021,
  title =      "Multiscale Unfolding: Illustratively Visualizing the Whole
               Genome at a Glance",
  author =     "Sarkis Halladjian and David Kou\v{r}il and Haichao Miao and
               Eduard Gr\"{o}ller and Ivan Viola and Tobias Isenberg",
  year =       "2021",
  abstract =   "We present Multiscale Unfolding, an interactive technique
               for illustratively visualizing multiple hierarchical scales
               of DNA in a single view, showing the genome at different
               scales and demonstrating how one scale spatially folds into
               the next. The DNA’s extremely long sequential
               structure—arranged differently on several distinct scale
               levels—is often lost in traditional 3D depictions, mainly
               due to its multiple levels of dense spatial packing and the
               resulting occlusion. Furthermore, interactive exploration of
               this complex structure is cumbersome, requiring visibility
               management like cut-aways. In contrast to existing
               temporally controlled multiscale data exploration, we allow
               viewers to always see and interact with any of the involved
               scales. For this purpose we separate the depiction into
               constant-scale and scale transition zones. Constant-scale
               zones maintain a single-scale representation, while still
               linearly unfolding the DNA. Inspired by illustration, scale
               transition zones connect adjacent constant-scale zones via
               level unfolding, scaling, and transparency. We thus
               represent the spatial structure of the whole DNA
               macro-molecule, maintain its local organizational
               characteristics, linearize its higher-level organization,
               and use spatially controlled, understandable interpolation
               between neighboring scales. We also contribute interaction
               techniques that provide viewers with a coarse-to-fine
               control for navigating within our all-scales-in-one-view
               representations and visual  aids to illustrate the size
               differences. Overall, Multiscale Unfolding allows viewers to
               grasp the DNA’s structural composition from  chromosomes
               to the atoms, with increasing levels of “unfoldedness,”
               and can be applied in data-driven illustration and
               communication. ",
  month =      mar,
  doi =        "10.1109/TVCG.2021.3065443",
  journal =    "IEEE TRANSACTIONS ON VISUALIZATION AND COMPUTER GRAPHICS ",
  volume =     "3",
  pages =      "1--13",
  URL =        "https://www.cg.tuwien.ac.at/research/publications/2021/Sarkis_2021/",
}