

 Bachelor thesis
Information
- Publication Type: Bachelor Thesis
- Workgroup(s)/Project(s):
- Date: August 2020
- Date (Start): 2. March 2020
- Date (End): 20. August 2020
- Matrikelnummer: 00827420
- First Supervisor: Kresimir Matkovic

Abstract
behaviourists and ethologists study cognitive abilities such as learning and memory in rodents to get a better understanding of how similar processes in humans proceed. Often such studies are based on experiments of rodents placed and observed in a Multiple T-Maze. There, the path of the animals are recorded as they move inside the maze, and the resulting trajectories are then analysed. State-of-the-art analysis is based on descriptive parameters and standard statistics where one trajectory at a time is analysed. Usually it is not possible to examine multiple animal paths simultaneously. Together with experts on the field we abstracted the typical work-flow of such analyses and developed an interactive visual analytics tool, with the goal to facilitate the experts’ work and enable a deeper and novel understanding of the learning ability and decision making in rodents. After giving an overview of related works and computer-aided analysis tools in the beginning, the analysis demands and task-breakdown is presented, followed by an Explanation of the data acquisition process, data preprocessing and aggregation. The underlying data structure will be explained as well. The developed analysis tool — the T-Maze Explorer — supports multiple, linked views, which support several traditional methods of visualizations, as well as two newly proposed visualizations fitted to meet the experts’ analysis demands. The first view — the T-Maze View — displays all trajectories of an ensemble with additional options such as highlighting the return path. The purpose of the second view — the Gate-O-Gon view — is to extract information from the trajectories on how often returns in the path occurred and between which parts of the maze these occurred. This information is depicted in a compact and informative novel visualization. The purpose of the T-Maze Explorer is to enable its user to easily find patterns in the data and identify irregular behaviour while inspecting a single path, multiple or the whole trajectory ensemble simultaneously. This thesis provides an insight on how the proposed visualizations were developed, the T-Maze Explorer’s characteristics and benefits as well as it’s limitations. Lastly, a brief excerpt is given on how the T-Maze Explorer could be extended in the future.Additional Files and Images

Weblinks
No further information available.BibTeX
@bachelorsthesis{Bechtold2020,
title = "Getting Insight on Animal Behaviour through Interactive
Visualization of Multiple T-Maze Ensembles",
author = "Fabrizia Bechtold",
year = "2020",
abstract = "behaviourists and ethologists study cognitive abilities such
as learning and memory in rodents to get a better
understanding of how similar processes in humans proceed.
Often such studies are based on experiments of rodents
placed and observed in a Multiple T-Maze. There, the path of
the animals are recorded as they move inside the maze, and
the resulting trajectories are then analysed.
State-of-the-art analysis is based on descriptive parameters
and standard statistics where one trajectory at a time is
analysed. Usually it is not possible to examine multiple
animal paths simultaneously. Together with experts on the
field we abstracted the typical work-flow of such analyses
and developed an interactive visual analytics tool, with the
goal to facilitate the experts’ work and enable a deeper
and novel understanding of the learning ability and decision
making in rodents. After giving an overview of related works
and computer-aided analysis tools in the beginning, the
analysis demands and task-breakdown is presented, followed
by an Explanation of the data acquisition process, data
preprocessing and aggregation. The underlying data structure
will be explained as well. The developed analysis tool —
the T-Maze Explorer — supports multiple, linked views,
which support several traditional methods of visualizations,
as well as two newly proposed visualizations fitted to meet
the experts’ analysis demands. The first view — the
T-Maze View — displays all trajectories of an ensemble
with additional options such as highlighting the return
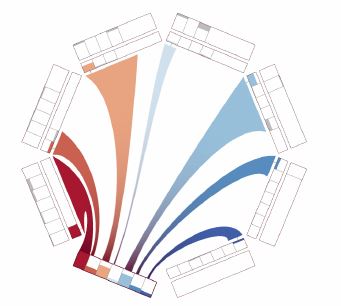
path. The purpose of the second view — the Gate-O-Gon view
— is to extract information from the trajectories on how
often returns in the path occurred and between which parts
of the maze these occurred. This information is depicted in
a compact and informative novel visualization. The purpose
of the T-Maze Explorer is to enable its user to easily find
patterns in the data and identify irregular behaviour while
inspecting a single path, multiple or the whole trajectory
ensemble simultaneously. This thesis provides an insight on
how the proposed visualizations were developed, the T-Maze
Explorer’s characteristics and benefits as well as it’s
limitations. Lastly, a brief excerpt is given on how the
T-Maze Explorer could be extended in the future.",
month = aug,
address = "Favoritenstrasse 9-11/E193-02, A-1040 Vienna, Austria",
school = "Research Unit of Computer Graphics, Institute of Visual
Computing and Human-Centered Technology, Faculty of
Informatics, TU Wien ",
URL = "https://www.cg.tuwien.ac.at/research/publications/2020/Bechtold2020/",
}