

 Master Thesis
 Poster
Information
- Publication Type: Master Thesis
- Workgroup(s)/Project(s):
- Date: October 2019
- Date (Start): September 2016
- Date (End): 1. October 2019
- TU Wien Library:
- Open Access: yes
- First Supervisor: Eduard Gröller

Abstract
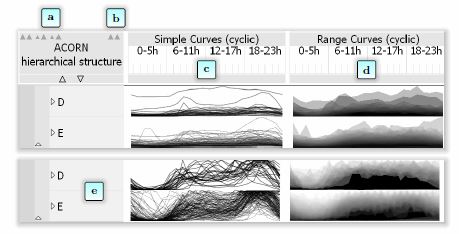
The number of installed sensors to acquire data, for example electricity meters in smart grids, is increasing rapidly. The huge amount of collected data needs to be analyzed and monitored by transmission-system operators. This task is supported by visual analytics techniques, but traditional multi-dimensional data visualization techniques do not scale very well for high-dimensional data. The main contribution of this thesis is a framework to efficiently examine and compare such high-dimensional data. The key idea is to divide the data by the semantics of the underlying dimensions into groups. Domain experts are familiar with the meta-information of the data and are able to structure these groups into a hierarchy. Various statistical properties are calculated from the subdivided data. These are then visualized by the proposed system using appropriate means. The hierarchy and the visualizations of the calculated statistical values are displayed in a tabular layout. The rows contain the subdivided data and the columns visualize their statistics. Flexible interaction possibilities with the visual representation help the experts to fulfill their analysis tasks. The tasks include searching for structures, sorting by statistical properties, identifying correlations of the subdivided data, and interactively subdivide or combine the data. A usage scenario evaluates the design of the framework with a data set of the target domain in the energy sector.Additional Files and Images


Weblinks
No further information available.BibTeX
@mastersthesis{Pfahler-2016-MT,
  title =      "Visualisierung hochdimensionaler Daten mit hierarchischer
               Gruppierung von Teilmengen",
  author =     "David Pfahler",
  year =       "2019",
  abstract =   "The number of installed sensors to acquire data, for example
               electricity meters in smart grids, is increasing rapidly.
               The huge amount of collected data needs to be analyzed and
               monitored by transmission-system operators. This task is
               supported by visual analytics techniques, but traditional
               multi-dimensional data visualization techniques do not scale
               very well for high-dimensional data. The main contribution
               of this thesis is a framework to efficiently examine and
               compare such high-dimensional data. The key idea is to
               divide the data by the semantics of the underlying
               dimensions into groups. Domain experts are familiar with the
               meta-information of the data and are able to structure these
               groups into a hierarchy. Various statistical properties are
               calculated from the subdivided data. These are then
               visualized by the proposed system using appropriate means.
               The hierarchy and the visualizations of the calculated
               statistical values are displayed in a tabular layout. The
               rows contain the subdivided data and the columns visualize
               their statistics. Flexible interaction possibilities with
               the visual representation help the experts to fulfill their
               analysis tasks. The tasks include searching for structures,
               sorting by statistical properties, identifying correlations
               of the subdivided data, and interactively subdivide or
               combine the data. A usage scenario evaluates the design of
               the framework with a data set of the target domain in the
               energy sector.",
  month =      oct,
  address =    "Favoritenstrasse 9-11/E193-02, A-1040 Vienna, Austria",
  school =     "Research Unit of Computer Graphics, Institute of Visual
               Computing and Human-Centered Technology, Faculty of
               Informatics, TU Wien",
  URL =        "https://www.cg.tuwien.ac.at/research/publications/2019/Pfahler-2016-MT/",
}