

Wolfgang Ludwig
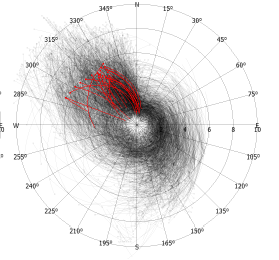
Radial Diagrams for the Visual Analysis of Wind Energy Production Data
[image] [ Poster]
Information
- Publication Type: Master Thesis
- Workgroup(s)/Project(s):
- Date: October 2018
- Date (Start): 2012
- Date (End): 10. October 2018
- TU Wien Library:
- First Supervisor:
- Harald Piringer
- Eduard Gröller

Abstract
Wind energy production is a fast growing sector in the field of renewable energy production. In the process of energy production, more and more data is produced and recorded every year. This data is usually worthless without further exploration, analysis, and presentation. This thesis presents a design study of the visual analysis of wind energy production data. The goal is to provide data analysts with tools to carry out common tasks in the field of wind energy production more efficiently. As the data commonly contains directional information of winds and gusts, analysis techniques need to take the circular nature of such data into account. This work proposes a set of techniques for the visualization and interaction with circular data in radial diagrams. The diagrams operate in the polar coordinate system and thus are well suited to solve the problems of maintaining the natural coherence and circular closure of circular data. The thesis discusses important design decisions and gives practical guidance how to implement novel features into an existing software system. Implementation details on how to ensure large data scalability are presented. The work evaluates the results in a case study with real data carried out by an expert in the field of wind energy production. The results indicate an improved work flow of common tasks and a successful system integration. The reported deployment at a national power grid operator further demonstrates the system’s user acceptance and importance. The thesis also reflects on the iterative design process and the within collected expert feedback.Additional Files and Images


Weblinks
No further information available.BibTeX
@mastersthesis{ludwig-2012-MT,
  title =      "Radial Diagrams for the Visual Analysis of Wind Energy
               Production Data",
  author =     "Wolfgang Ludwig",
  year =       "2018",
  abstract =   "Wind energy production is a fast growing sector in the field
               of renewable energy production. In the process of energy
               production, more and more data is produced and recorded
               every year. This data is usually worthless without further
               exploration, analysis, and presentation. This thesis
               presents a design study of the visual analysis of wind
               energy production data. The goal is to provide data analysts
               with tools to carry out common tasks in the field of wind
               energy production more efficiently. As the data commonly
               contains directional information of winds and gusts,
               analysis techniques need to take the circular nature of such
               data into account. This work proposes a set of techniques
               for the visualization and interaction with circular data in
               radial diagrams. The diagrams operate in the polar
               coordinate system and thus are well suited to solve the
               problems of maintaining the natural coherence and circular
               closure of circular data.  The thesis discusses important
               design decisions and gives practical guidance how to
               implement novel features into an existing software system.
               Implementation details on how to ensure large data
               scalability are presented. The work evaluates the results in
               a case study with real data carried out by an expert in the
               field of wind energy production. The results indicate an
               improved work flow of common tasks and a successful system
               integration. The reported deployment at a national power
               grid operator further demonstrates the system’s user
               acceptance and importance. The thesis also reflects on the
               iterative design process and the within collected expert
               feedback.",
  month =      oct,
  address =    "Favoritenstrasse 9-11/E193-02, A-1040 Vienna, Austria",
  school =     "Institute of Computer Graphics and Algorithms, Vienna
               University of Technology ",
  URL =        "https://www.cg.tuwien.ac.at/research/publications/2018/ludwig-2012-MT/",
}