

Matthias Gusenbauer
Bitstream - Top-Down/Bottom-Up Data Processing for Interactive Bitcoin Visualization.
Poster shown at EPILOG
(18. June 2018)
[image]
Information
- Publication Type: Poster
- Workgroup(s)/Project(s):
- Date: May 2018
- Event: EPILOG
- Conference date: 18. June 2018
Abstract
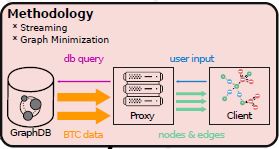
Analyzing large amounts of data is becoming an ever increasing problem. Bitcoin as an example has produced more data than is possible to analyze. In order to compensate for these difficulties, creative ideas that employ data aggregation or minimization have been proposed. Other work also focuses on introducing novel visualization types that are geared towards the visualization of blockchain data. However, visualization of graphs through node-link diagrams remains a difficult challenge. Analysis of the Bitcoin transaction graph to follow bitcoin (BTC) transactions (TXs) poses a difficult problem due to the Bitcoin protocol and the amount of data. This thesis combines two data processing strategies to visualize big network data on commodity hardware. The idea is to use visualization as a technique to analyze a data-set containing Bitcoin transaction information. Criminals use Bitcoin as a means of payment because of its guaranteed pseudonymity. Through visualization we aim to identify patterns that will allow us to deanonymize transactions. To do so we use a proxy server that does data preprocessing before they are visualized on a web client. The proxy leverages parallel computing to be able to do top-down and bottom-up data processing fast enough for interactive visualization. This is done through incremental loading (bottom-up), which enables to visualize data immediately without a (pre-)processing delay. The database containing the public Bitcoin ledger is over 163 gigabytes in size. The resulting graph has more than 800 million nodes. As this information is too much to be visualized, we also employ a top-down approach of data aggregation and graph minimization of the transactional graph. Through this methodology we intend to solve performance problems of long processing delays and the problem of fractured data where the data is shown only partially in the visualization. We collaborate with security experts who share insights into their expertise through a continuously ongoing dialog. Exploratory analysis on a big data-set such as the Bitcoin ledger, enabled through the methodology presented in this thesis, will help security experts to analyze the money flow in a financial network that is used by criminals for its anonymity. We evaluate the result through the performance and feedback of these security experts as well as benchmark the performance against current best practice approaches.Additional Files and Images

Weblinks
No further information available.BibTeX
@misc{gusenbauer-2018-P,
  title =      "Bitstream - Top-Down/Bottom-Up Data Processing for
               Interactive Bitcoin Visualization.",
  author =     "Matthias Gusenbauer",
  year =       "2018",
  abstract =   "Analyzing large amounts of data is becoming an ever
               increasing problem. Bitcoin as an example has produced more
               data than is possible to analyze. In order to compensate for
               these difficulties, creative ideas that employ data
               aggregation or minimization have been proposed. Other work
               also focuses on introducing novel visualization types that
               are geared towards the visualization of blockchain data.
               However, visualization of graphs through node-link diagrams
               remains a difficult challenge. Analysis of the Bitcoin
               transaction graph to follow bitcoin (BTC) transactions (TXs)
               poses a difficult problem due to the Bitcoin protocol and
               the amount of data. This thesis combines two data processing
               strategies to visualize big network data on commodity
               hardware. The idea is to use visualization as a technique to
               analyze a data-set containing Bitcoin transaction
               information. Criminals use Bitcoin as a means of payment
               because of its guaranteed pseudonymity. Through
               visualization we aim to identify patterns that will allow us
               to deanonymize transactions. To do so we use a proxy server
               that does data preprocessing before they are visualized on a
               web client. The proxy leverages parallel computing to be
               able to do top-down and bottom-up data processing fast
               enough for interactive visualization. This is done through
               incremental loading (bottom-up), which enables to visualize
               data immediately without a (pre-)processing delay. The
               database containing the public Bitcoin ledger is over 163
               gigabytes in size. The resulting graph has more than 800
               million nodes. As this information is too much to be
               visualized, we also employ a top-down approach of data
               aggregation and graph minimization of the transactional
               graph. Through this methodology we intend to solve
               performance problems of long processing delays and the
               problem of fractured data where the data is shown only
               partially in the visualization. We collaborate with security
               experts who share insights into their expertise through a
               continuously ongoing dialog. Exploratory analysis on a big
               data-set such as the Bitcoin ledger, enabled through the
               methodology presented in this thesis, will help security
               experts to analyze the money flow in a financial network
               that is used by criminals for its anonymity. We evaluate the
               result through the performance and feedback of these
               security experts as well as benchmark the performance
               against current best practice approaches.",
  month =      may,
  event =      "EPILOG",
  Conference date = "Poster presented at EPILOG (2018-06-18)",
  URL =        "https://www.cg.tuwien.ac.at/research/publications/2018/gusenbauer-2018-P/",
}