

Nikolaus Karall
Comparative Visual Analytics in a Cohort of Breast Cancer Patients
Poster shown at EPILOG
(18. June 2018)
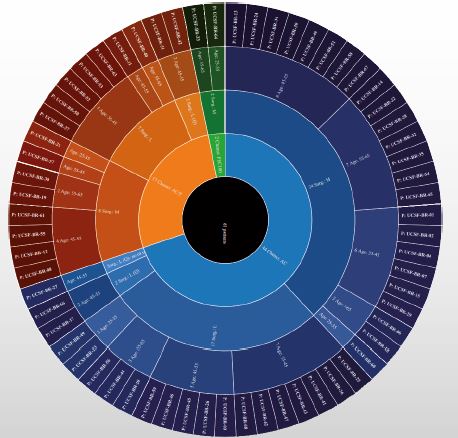
[image] [ Poster]
Information
- Publication Type: Poster
- Workgroup(s)/Project(s):
- Date: May 2018
- Event: EPILOG
- Conference date: 18. June 2018
Abstract
The most common cancer among the female population in the economically developed world is breast cancer. To signifcantly reduce the mortality among affected women an early diagnosis is essential, and also treatment strategies need to be selected carefully. Clinical researchers working on the selection of chemotherapy treatment need to analyze the progress of the disease during and after treatment and to understand how diffent groups of patients respond to selected treatments. Currently this is a diffcult task because of the multitude of involved imaging and non-imaging) data, for which adequate visualizations are required. The aim of this work is to help clinical researchers, who are working on the analysis of the progress of chemotherapy, to understand and explore the multitude of data they have. To this end, the following three tasks were realized in a web-based framework: 1. Functionality for single patient follow-up studies (intra-patient study) 2. Functionality to compare two different patients (pairwise inter-patient study) 3. Functionality to compare groups of patients (groupwise inter-patient study) In the examples below, we demonstrate only the latter, as it can be considered an overset of the other two tasks.Additional Files and Images

Weblinks
No further information available.BibTeX
@misc{Karall2018_2,
  title =      "Comparative Visual Analytics in a Cohort of Breast Cancer
               Patients",
  author =     "Nikolaus Karall",
  year =       "2018",
  abstract =   "The most common cancer among the female population in the
               economically developed world is breast cancer. To
               signifcantly reduce the mortality among affected women an
               early diagnosis is essential, and also treatment strategies
               need to be selected carefully. Clinical researchers working
               on the selection of chemotherapy treatment need to analyze
               the progress of the disease during and after treatment and
               to understand how diffent groups of patients respond to
               selected treatments. Currently this is a diffcult task
               because of the multitude of involved imaging and
               non-imaging) data, for which adequate visualizations are
               required. The aim of this work is to help clinical
               researchers, who are working on the analysis of the progress
               of chemotherapy, to understand and explore the multitude of
               data they have. To this end, the following three tasks were
               realized in a web-based framework: 1. Functionality for
               single patient follow-up studies (intra-patient study) 2.
               Functionality to compare two different patients (pairwise
               inter-patient study) 3. Functionality to compare groups of
               patients (groupwise inter-patient study) In the examples
               below, we demonstrate only the latter, as it can be
               considered an overset of the other two tasks.",
  month =      may,
  event =      "EPILOG ",
  Conference date = "Poster presented at EPILOG  (2018-06-18)",
  URL =        "https://www.cg.tuwien.ac.at/research/publications/2018/Karall2018_2/",
}