

Information
- Publication Type: Bachelor Thesis
- Workgroup(s)/Project(s):
- Date: September 2016
- Date (Start): May 2016
- Date (End): September 2016
- Matrikelnummer: 1225883
- First Supervisor: Manuela Waldner

Abstract
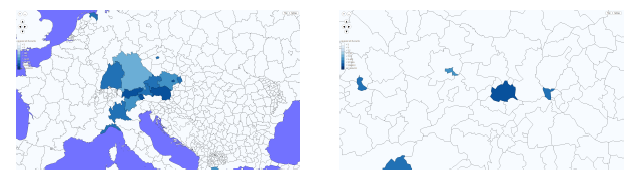
Geographic visualizations, like choropleth maps, are used to visualize data on geographic regions. In this thesis a choropleth map was implemented to display quantities of publications of scientific texts and papers. With the use of a choropleth map the viewer is able to interpret how quantitative data changes on different geographic regions. The main feature that distinguishes the implemented choropleth map from conventional ones is the use of map navigation. The choropleth map can be zoomed and panned to different map regions. What makes this map navigation so special is the use of semantic zooming to allow the level of detail of the map to change on discrete zoom steps. The change of the level of detail means that administrative regions are being divided into smaller administrative regions which are than again colorized individually to create a new, more detailed, choropleth map. Other interactions with the choropleth map are introduced additionally. The other interactions with the map range from the manipulation of the map appearance to filtering the displayed data set.Additional Files and Images

Weblinks
No further information available.BibTeX
@bachelorsthesis{dworschak-2016-szcm,
  title =      "Semantically Zoomable Choropleth Map",
  author =     "Lucas Dworschak",
  year =       "2016",
  abstract =   "Geographic visualizations, like choropleth maps, are used to
               visualize data on geographic regions. In this thesis a
               choropleth map was implemented to display quantities of
               publications of scientific texts and papers. With the use of
               a choropleth map the viewer is able to interpret how
               quantitative data changes on different geographic regions.
               The main feature that distinguishes the implemented
               choropleth map from conventional ones is the use of map
               navigation. The choropleth map can be zoomed and panned to
               different map regions. What makes this map navigation so
               special is the use of semantic zooming to allow the level of
               detail of the map to change on discrete zoom steps. The
               change of the level of detail means that administrative
               regions are being divided into smaller administrative
               regions which are than again colorized individually to
               create a new, more detailed, choropleth map. Other
               interactions with the choropleth map are introduced
               additionally. The other interactions with the map range from
               the manipulation of the map appearance to filtering the
               displayed data set.",
  month =      sep,
  address =    "Favoritenstrasse 9-11/E193-02, A-1040 Vienna, Austria",
  school =     "Institute of Computer Graphics and Algorithms, Vienna
               University of Technology ",
  URL =        "https://www.cg.tuwien.ac.at/research/publications/2016/dworschak-2016-szcm/",
}