

Johannes Weissenböck, Artem Amirkhanov, Eduard Gröller , Johannes Kastner, Christoph Heinzl
PorosityAnalyzer: Visual Analysis and Evaluation of Segmentation Pipelines to Determine the Porosity in Fiber-Reinforced Polymers
In IEEE Conference on Visual Analytics Science and Technology, 2016 (VAST 2016), pages 101-110. October 2016.
[image]
Information
- Publication Type: Conference Paper
- Workgroup(s)/Project(s):
- Date: October 2016
- Publisher: IEEE Computer Society
- Lecturer: John Stasko
- Booktitle: IEEE Conference on Visual Analytics Science and Technology, 2016 (VAST 2016)
- Pages: 101 – 110
Abstract
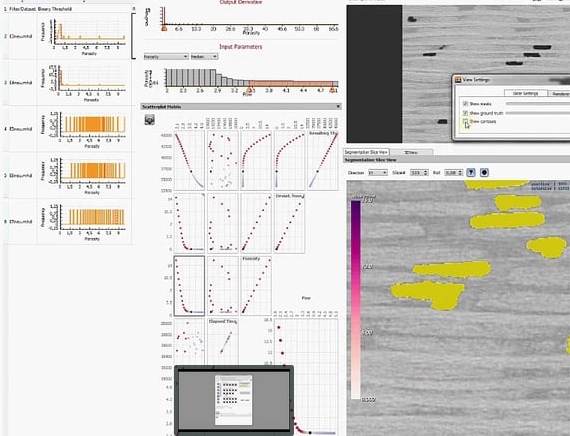
In this paper we present PorosityAnalyzer, a novel tool for detailed evaluation and visual analysis of pore segmentation pipelines to determine the porosity in fiber-reinforced polymers (FRPs). The presented tool consists of two modules: the computation module and the analysis module. The computation module enables a convenient setup and execution of distributed off-line-computations on industrial 3D X-ray computed tomography datasets. It allows the user to assemble individual segmentation pipelines in the form of single pipeline steps, and to specify the parameter ranges as well as the sampling of the parameter-space of each pipeline segment. The result of a single segmentation run consists of the input parameters, the calculated 3D binary-segmentation mask, the resulting porosity value, and other derived results (e.g., segmentation pipeline runtime). The analysis module presents the data at different levels of detail by drill-down filtering in order to determine accurate and robust segmentation pipelines. Overview visualizations allow to initially compare and evaluate the segmentation pipelines. With a scatter plot matrix (SPLOM), the segmentation pipelines are examined in more detail based on their input and output parameters. Individual segmentation-pipeline runs are selected in the SPLOM and visually examined and compared in 2D slice views and 3D renderings by using aggregated segmentation masks and statistical contour renderings. PorosityAnalyzer has been thoroughly evaluated with the help of twelve domain experts. Two case studies demonstrate the applicability of our proposed concepts and visualization techniques, and show that our tool helps domain experts to gain new insights and improve their workflow efficiency.Additional Files and Images
Weblinks
BibTeX
@inproceedings{Groeller_2016_P6,
  title =      "PorosityAnalyzer: Visual Analysis and Evaluation of
               Segmentation  Pipelines to Determine the Porosity in
               Fiber-Reinforced Polymers",
  author =     "Johannes Weissenb\"{o}ck and Artem Amirkhanov and Eduard
               Gr\"{o}ller and Johannes Kastner and Christoph Heinzl",
  year =       "2016",
  abstract =   "In this paper we present PorosityAnalyzer, a novel tool for
               detailed evaluation and visual analysis of pore segmentation
               pipelines to determine the porosity in fiber-reinforced
               polymers (FRPs). The presented tool consists of two modules:
               the computation module and the analysis module. The
               computation module enables a convenient setup and execution
               of distributed off-line-computations on industrial 3D X-ray
               computed tomography datasets. It allows the user to assemble
               individual segmentation pipelines in the form of single
               pipeline steps, and to specify the parameter ranges as well
               as the sampling of the parameter-space of each pipeline
               segment. The result of a single segmentation run consists of
               the input parameters, the calculated 3D binary-segmentation
               mask, the resulting porosity value, and other derived
               results (e.g., segmentation pipeline runtime). The analysis
               module presents the data at different levels of detail by
               drill-down filtering in order to determine accurate and
               robust segmentation pipelines. Overview visualizations allow
               to initially compare and evaluate the segmentation
               pipelines. With a scatter plot matrix (SPLOM), the
               segmentation pipelines are examined in more detail based on
               their input and output parameters. Individual
               segmentation-pipeline runs are selected in the SPLOM and
               visually examined and compared in 2D slice views and 3D
               renderings by using aggregated segmentation masks and
               statistical contour renderings. PorosityAnalyzer has been
               thoroughly evaluated with the help of twelve domain experts.
               Two case studies demonstrate the applicability of our
               proposed concepts and visualization techniques, and show
               that our tool helps domain experts to gain new insights and
               improve their workflow efficiency.",
  month =      oct,
  publisher =  "IEEE Computer Society",
  booktitle =  "IEEE Conference on Visual Analytics Science and Technology,
               2016 (VAST 2016)",
  pages =      "101--110",
  URL =        "https://www.cg.tuwien.ac.at/research/publications/2016/Groeller_2016_P6/",
}