

Johannes Weissenböck, Artem Amirkhanov, Weimin Li, Andreas Reh, Aleksandr Amirkhanov, Eduard Gröller , Johann Kastner, Christoph Heinzl
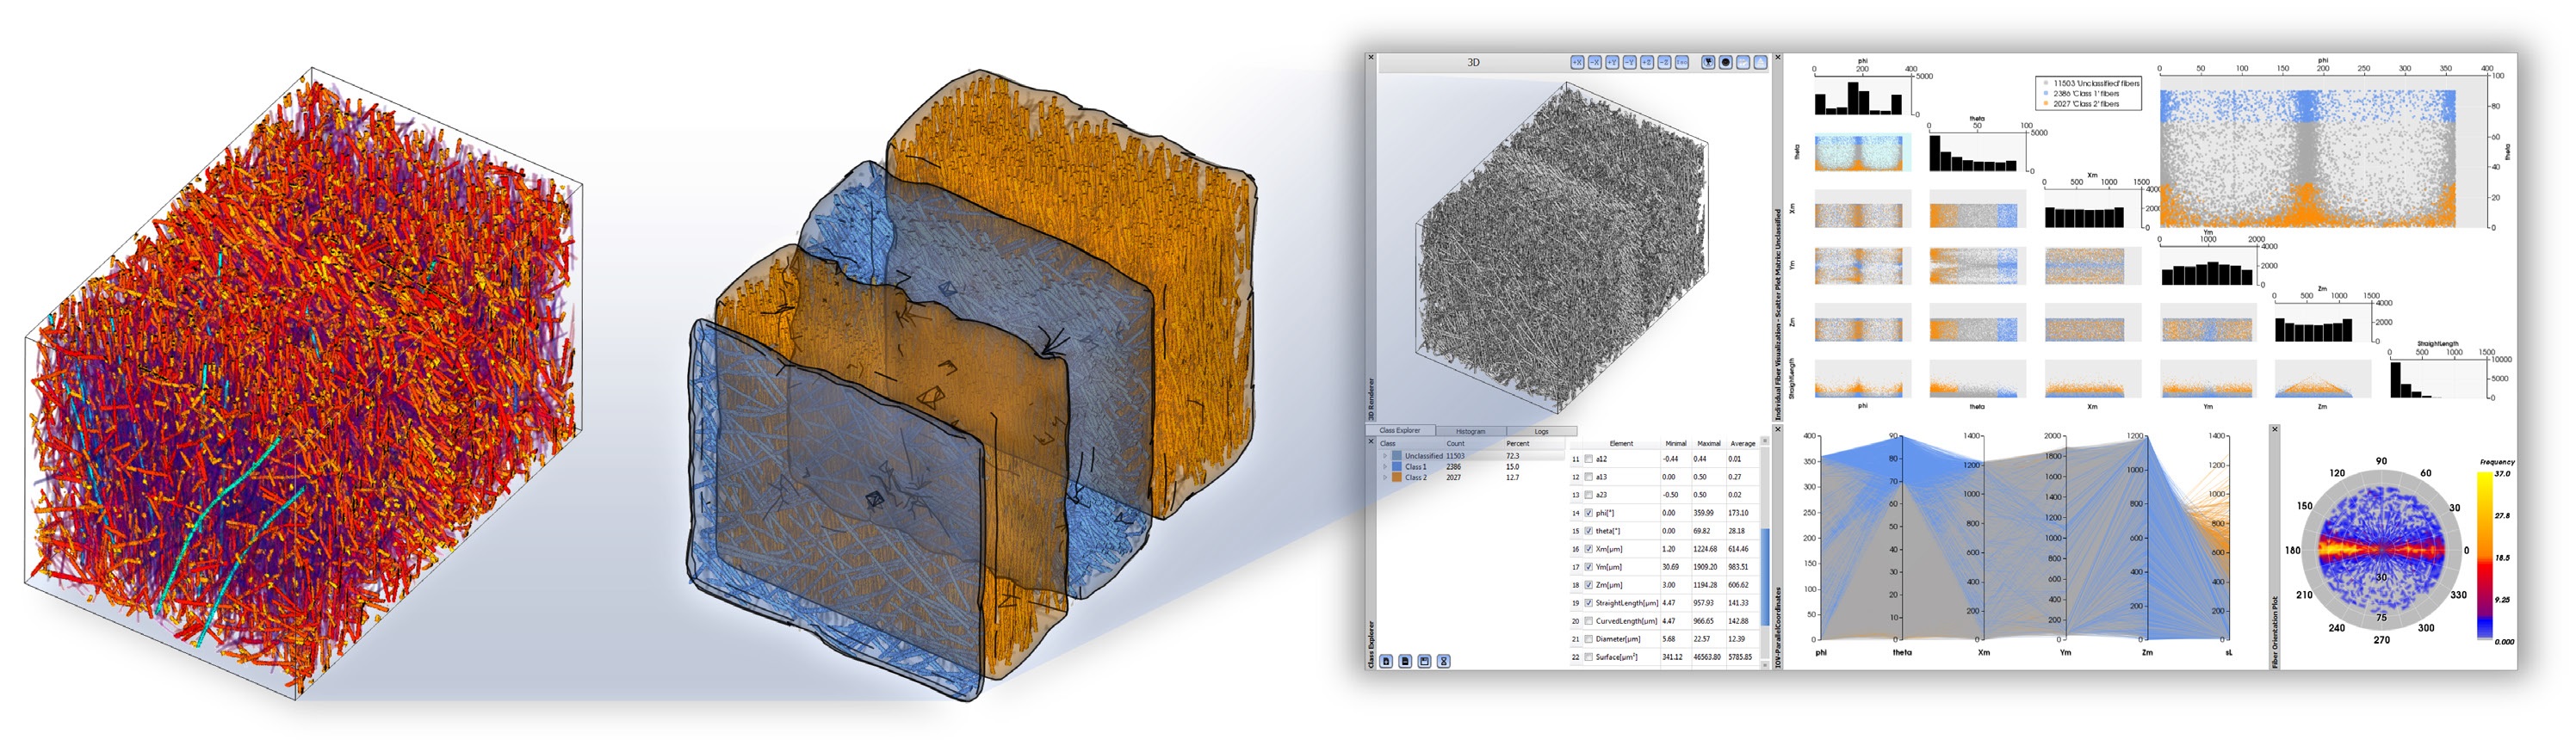
FiberScout: An Interactive Tool for Exploring and Analyzing Fiber Reinforced Polymers
In Proceedings of 2014 IEEE Pacific Visualization Symposium (PacificVis) (2014), pages 153-160. March 2014.
[ paper] [
![]() presentation] [
presentation] [ submitted video] [
 blob ext video] [
 blobs video] [
 classification video] [
 metadata video]
Information
- Publication Type: Conference Paper
- Workgroup(s)/Project(s):
- Date: March 2014
- ISBN: 978-1-4799-2874-3
- Publisher: IEEE Computer Society
- Location: Yokohama
- Lecturer: Johannes Weissenböck
- Booktitle: Proceedings of 2014 IEEE Pacific Visualization Symposium (PacificVis) (2014)
- Conference date: 4. March 2014 – 7. March 2014
- Pages: 153 – 160
Abstract
Advanced composites such as fiber reinforced polymers are promising candidate materials for future components as they allow integrating the continuously rising demands of industry regarding costeffectiveness, function-orientation, integration and weight. The most important structures of fiber reinforced polymers are the individual fibers, as their characteristics (stiffness, strength, ductility, durability, etc.) to a large extent determine the properties of the final component. The main contribution of this paper is the introduction of a new system for interactive exploration and visual analysis of fiber properties in X-ray computed tomography data of fiber reinforced polymers. The presented tool uses parallel coordinates to define and configure initial fiber classes. Using a scatter plot matrix linked to the parallel coordinates the initial classification may be refined. This allows to analyze hidden relationships between individual fiber properties. 2D and 3D views depict the resulting fiber classifications. By using polar plots an intuitive rendering of the fiber orientation distribution is provided. In addition, two modules of higher abstraction are proposed: The Blob visualization creates a hull around fibers with similar characteristics. The fiber metadata visualization allows to calculate overlays for 2D and 3D views containing regional information of particular material characteristics. The proposed system has been evaluated by two groups of domain experts. Applying the presented concepts the user feedback shows that the domain experts are now able to efficiently perform tasks as classification of fibers, visualization of fiber lengths and orientations, and visualization of fiber regions. The insights gained can be forwarded to the design office as well as to material development and simulation, in order to speed up the development of novel composite components.Additional Files and Images


Weblinks
No further information available.BibTeX
@inproceedings{weissenboeck-2014,
  title =      "FiberScout: An Interactive Tool for Exploring and Analyzing
               Fiber Reinforced Polymers",
  author =     "Johannes Weissenb\"{o}ck and Artem Amirkhanov and Weimin Li
               and Andreas Reh and Aleksandr Amirkhanov and Eduard
               Gr\"{o}ller and Johann Kastner and Christoph Heinzl",
  year =       "2014",
  abstract =   "Advanced composites such as fiber reinforced polymers are
               promising candidate materials for future components as they
               allow integrating the continuously rising demands of
               industry regarding costeffectiveness, function-orientation,
               integration and weight. The most important structures of
               fiber reinforced polymers are the individual fibers, as
               their characteristics (stiffness, strength, ductility,
               durability, etc.) to a large extent determine the properties
               of the final component. The main contribution of this paper
               is the introduction of a new system for interactive
               exploration and visual analysis of fiber properties in X-ray
               computed tomography data of fiber reinforced polymers. The
               presented tool uses parallel coordinates to define and
               configure initial fiber classes. Using a scatter plot matrix
               linked to the parallel coordinates the initial
               classification may be refined. This allows to analyze hidden
               relationships between individual fiber properties. 2D and 3D
               views depict the resulting fiber classifications. By using
               polar plots an intuitive rendering of the fiber orientation
               distribution is provided. In addition, two modules of higher
               abstraction are proposed: The Blob visualization creates a
               hull around fibers with similar characteristics. The fiber
               metadata visualization allows to calculate overlays for 2D
               and 3D views containing regional information of particular
               material characteristics. The proposed system has been
               evaluated by two groups of domain experts. Applying the
               presented concepts the user feedback shows that the domain
               experts are now able to efficiently perform tasks as
               classification of fibers, visualization of fiber lengths and
               orientations, and visualization of fiber regions. The
               insights gained can be forwarded to the design office as
               well as to material development and simulation, in order to
               speed up the development of novel composite components.",
  month =      mar,
  isbn =       "978-1-4799-2874-3 ",
  publisher =  "IEEE Computer Society",
  location =   "Yokohama",
  booktitle =  "Proceedings of 2014 IEEE Pacific Visualization Symposium
               (PacificVis) (2014)",
  pages =      "153--160",
  URL =        "https://www.cg.tuwien.ac.at/research/publications/2014/weissenboeck-2014/",
}