

Information
- Publication Type: Master Thesis
- Workgroup(s)/Project(s):
- Date: 2013
- TU Wien Library:
- First Supervisor: Eduard Gröller

Abstract
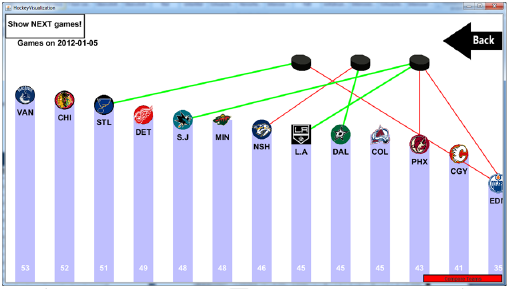
The last few years brought big progress in the field of Information visualization. There are many new and interesting ways to process and visualize the huge amount of data we collect in our everyday lifes, to make it easier to understand the meaning of the data. Nevertheless it is surprising, that it is very hard to find literature about visualizations of sport statistics, even though this data poses interesting challenges for finding and evaluating new visualization methods. In this thesis we evaluate and examine sport statistics, particularly icehockey statistics and we are looking for existing and new ways, to visualize them. In particular we are focusing on methods, which are suitable for mobile devices like smartphones and tablets, because those have totally different requirements than normal desktop computers. We also build a prototype, which visualizes different icehockey statistics: one to get the most important information of a league on one screen (league standings, past and future games), and a visualization, where the user can compare the statistics of two teams. We evaluated our method by comparing it with a regular table of statistics. Despite showing the strengths and weaknesses of the new method, the evaluation also posed some interesting approaches for future work in the area of sports visualization on mobile devices.Additional Files and Images


Weblinks
No further information available.BibTeX
@mastersthesis{bbeer-2013,
  title =      "Visualisierung von Eishockeystatistiken auf mobilen
               Endger\"{a}ten",
  author =     "Benjamin Beer",
  year =       "2013",
  abstract =   "The last few years brought big progress in the field of
               Information visualization. There are many new and
               interesting ways to process and visualize the huge amount of
               data we collect in our everyday lifes, to make it easier to
               understand the meaning of the data. Nevertheless it is
               surprising, that it is very hard to find literature about
               visualizations of sport statistics, even though this data
               poses interesting challenges for finding and evaluating new
               visualization methods. In this thesis we evaluate and
               examine sport statistics, particularly icehockey statistics
               and we are looking for existing and new ways, to visualize
               them. In particular we are focusing on methods, which are
               suitable for mobile devices like smartphones and tablets,
               because those have totally different requirements than
               normal desktop computers. We also build a prototype, which
               visualizes different icehockey statistics: one to get the
               most important information of a league on one screen (league
               standings, past and future games), and a visualization,
               where the user can compare the statistics of two teams. We
               evaluated our method by comparing it with a regular table of
               statistics. Despite showing the strengths and weaknesses of
               the new method, the evaluation also posed some interesting
               approaches for future work in the area of sports
               visualization on mobile devices.",
  address =    "Favoritenstrasse 9-11/E193-02, A-1040 Vienna, Austria",
  school =     "Institute of Computer Graphics and Algorithms, Vienna
               University of Technology ",
  URL =        "https://www.cg.tuwien.ac.at/research/publications/2013/bbeer-2013/",
}