

Zoltan Konyha
Interactive Visual Analysis in Automotive Engineering Design
Supervisor: Eduard Gröller
Duration: 2006 — 2013
[Image] [ Thesis]
Information
- Publication Type: PhD-Thesis
- Workgroup(s)/Project(s):
- Date: January 2013
- Date (Start): 2006
- Date (End): 2013
- TU Wien Library:
- Second Supervisor: Helwig Hauser
- 1st Reviewer: Eduard Gröller
- 2nd Reviewer: Helwig Hauser
- Rigorosum: 1. February 2013
- First Supervisor: Eduard Gröller
Abstract
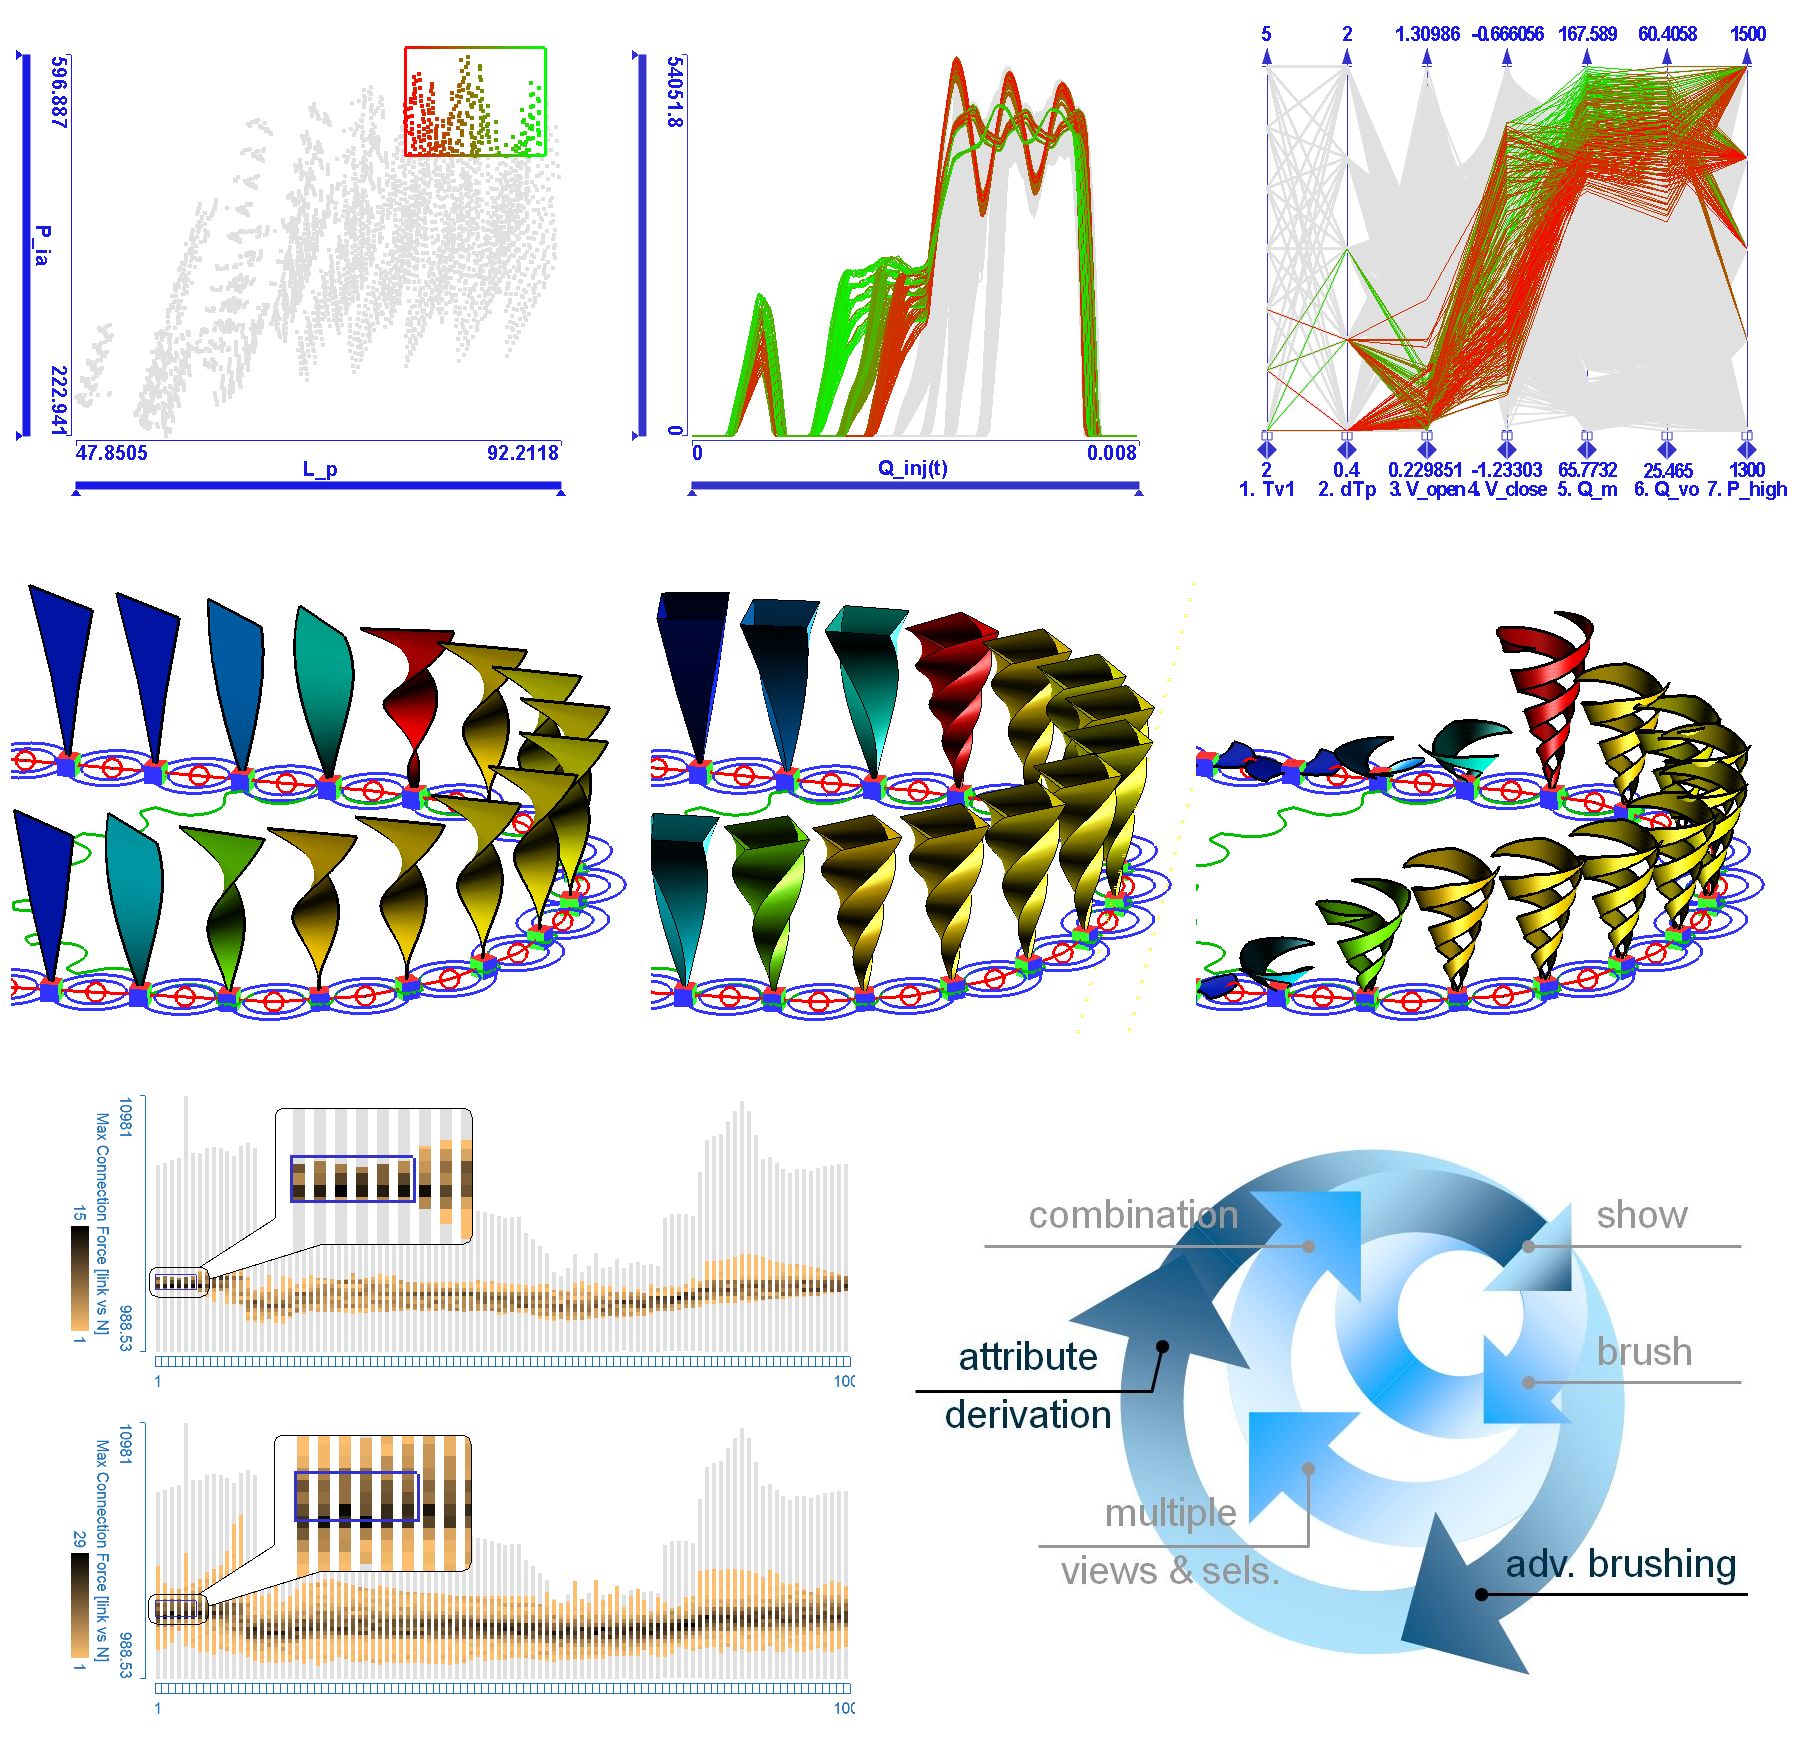
Computational simulation has become instrumental in the design process in automotive engineering. Virtually all components and subsystems of automobiles can be simulated. The simulation can be repeated many times with varied parameter settings, thereby simulating many possible design choices. Each simulation run can produce a complex, multivariate, and usually timedependent result data set. The engineers’ goal is to generate useful knowledge from those data. They need to understand the system’s behavior, find correlations in the results, conclude how results depend on the parameters, find optimal parameter combinations, and exclude the ones that lead to undesired results.Computational analysis methods are widely used and necessary to analyze simulation data sets, but they are not always sufficient. They typically require that problems and interesting data features can be precisely defined from the beginning. The results of automated analysis of complex problems may be difficult to interpret. Exploring trends, patterns, relations, and dependencies in time-dependent data through statistical aggregates is not always intuitive.
In this thesis, we propose techniques and methods for the interactive visual analysis (IVA) of simulation data sets. Compared to computational methods, IVA offers new and different analysis opportunities. Visual analysis utilizes human cognition and creativity, and can also incorporate the experts’ domain knowledge. Therefore, their insight into the data can be amplified, and also less precisely defined problems can be solved.
We introduce a data model that effectively represents the multi-run, time-dependent simulation results as families of function graphs. This concept is central to the thesis, and many of the innovations in this thesis are closely related to it.We present visualization techniques for families of function graphs. Those visualizations, as well as well-known information visualization plots, are integrated into a coordinated multiple views framework. All views provide focus+context visualization. Compositions of brushes spanning several views can be defined iteratively to select interesting features and promote information drill-down. Valuable insight into the spatial aspect of the data can be gained from (generally domain-specific) spatio-temporal visualizations. In this thesis, we propose interactive, glyph-based 3D visualization techniques for the analysis of rigid and elastic multibody system simulations.
We integrate the on-demand computation of derived data attributes of families of function graphs into the analysis workflow. This facilitates the selection of deeply hidden data features that cannot be specified by combinations of simple brushes on the original data attributes. The combination of these building blocks supports interactive knowledge discovery. The analyst can build a mental model of the system; explore also unexpected features and relations; and generate, verify or reject hypotheses with visual tools; thereby gaining more insight into the data. Complex tasks, such as parameter sensitivity analysis and optimization can be solved. Although the primary motivation for our work was the analysis of simulation data sets in automotive engineering, we learned that this data model and the analysis procedures we identified are also applicable to several other problem domains. We discuss common tasks in the analysis of data containing families of function graphs.
Two case studies demonstrate that the proposed approach is indeed applicable to the analysis of simulation data sets in automotive engineering. Some of the contributions of this thesis have been integrated into a commercially distributed software suite for engineers. This suggests that their impact can extend beyond the visualization research community.
Additional Files and Images

Weblinks
No further information available.BibTeX
@phdthesis{Konyha_2013_IVA,
  title =      "Interactive Visual Analysis in Automotive Engineering Design",
  author =     "Zoltan Konyha",
  year =       "2013",
  abstract =   "Computational simulation has become instrumental in the
               design process in automotive engineering. Virtually all
               components and subsystems of automobiles can be simulated.
               The simulation can be repeated many times with varied
               parameter settings, thereby simulating many possible design
               choices. Each simulation run can produce a complex,
               multivariate, and usually timedependent result data set. The
               engineers’ goal is to generate useful knowledge from those
               data. They need to understand the system’s behavior, find
               correlations in the results, conclude how results depend on
               the parameters, find optimal parameter combinations, and
               exclude the ones that lead to undesired results.
               Computational analysis methods are widely used and necessary
               to analyze simulation data sets, but they are not always
               sufficient. They typically require that problems and
               interesting data features can be precisely defined from the
               beginning. The results of automated analysis of complex
               problems may be difficult to interpret. Exploring trends,
               patterns, relations, and dependencies in time-dependent data
               through statistical aggregates is not always intuitive.  In
               this thesis, we propose techniques and methods for the
               interactive visual analysis (IVA) of simulation data sets.
               Compared to computational methods, IVA offers new and
               different analysis opportunities. Visual analysis utilizes
               human cognition and creativity, and can also incorporate the
               experts’ domain knowledge. Therefore, their insight into
               the data can be amplified, and also less precisely defined
               problems can be solved.  We introduce a data model that
               effectively represents the multi-run, time-dependent
               simulation results as families of function graphs. This
               concept is central to the thesis, and many of the
               innovations in this thesis are closely related to it.We
               present visualization techniques for families of function
               graphs. Those visualizations, as well as well-known
               information visualization plots, are integrated into a
               coordinated multiple views framework. All views provide
               focus+context visualization. Compositions of brushes
               spanning several views can be defined iteratively to select
               interesting features and promote information drill-down.
               Valuable insight into the spatial aspect of the data can be
               gained from (generally domain-specific) spatio-temporal
               visualizations. In this thesis, we propose interactive,
               glyph-based 3D visualization techniques for the analysis of
               rigid and elastic multibody system simulations.  We
               integrate the on-demand computation of derived data
               attributes of families of function graphs into the analysis
               workflow. This facilitates the selection of deeply hidden
               data features that cannot be specified by combinations of
               simple brushes on the original data attributes. The
               combination of these building blocks supports interactive
               knowledge discovery. The analyst can build a mental model of
               the system; explore also unexpected features and relations;
               and generate, verify or reject hypotheses with visual tools;
               thereby gaining more insight into the data. Complex tasks,
               such as parameter sensitivity analysis and optimization can
               be solved. Although the primary motivation for our work was
               the analysis of simulation data sets in automotive
               engineering, we learned that this data model and the
               analysis procedures we identified are also applicable to
               several other problem domains. We discuss common tasks in
               the analysis of data containing families of function graphs.
                Two case studies demonstrate that the proposed approach is
               indeed applicable to the analysis of simulation data sets in
               automotive engineering. Some of the contributions of this
               thesis have been integrated into a commercially distributed
               software suite for engineers. This suggests that their
               impact can extend beyond the visualization research
               community.",
  month =      jan,
  address =    "Favoritenstrasse 9-11/E193-02, A-1040 Vienna, Austria",
  school =     "Institute of Computer Graphics and Algorithms, Vienna
               University of Technology ",
  URL =        "https://www.cg.tuwien.ac.at/research/publications/2013/Konyha_2013_IVA/",
}