

Johannes Kehrer, Helwig Hauser
Visualization and Visual Analysis of Multi-faceted Scientific Data: A Survey
IEEE Transactions on Visualization and Computer Graphics, 19(3):495-513, March 2013. [ Draft] [
 Slides]
Information
- Publication Type: Journal Paper (without talk)
- Workgroup(s)/Project(s):
- Date: March 2013
- ISSN: 1077-2626
- Journal: IEEE Transactions on Visualization and Computer Graphics
- Note: Spotlight paper of the March issue of TVCG
- Number: 3
- Volume: 19
- Pages: 495 – 513
Abstract
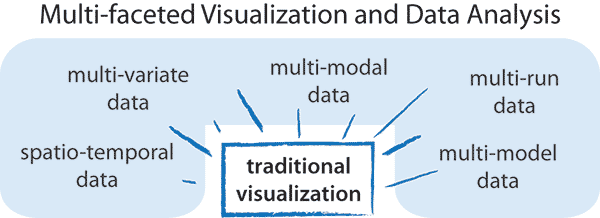
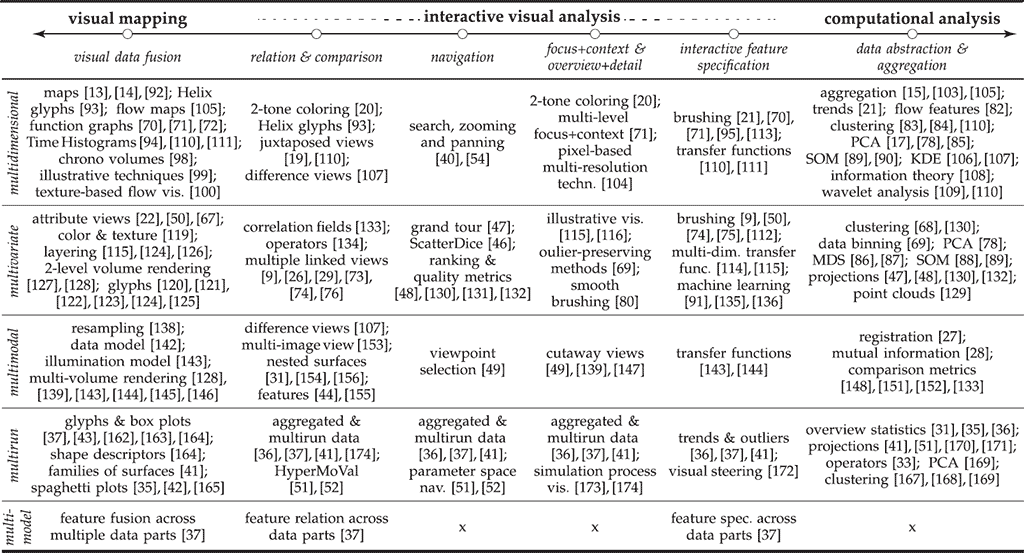
Visualization and visual analysis play important roles in exploring, analyzing and presenting scientific data. In many disciplines, data and model scenarios are becoming multi-faceted: data are often spatio-temporal and multi-variate; they stem from different data sources (multi-modal data), from multiple simulation runs (multi-run/ensemble data), or from multi-physics simulations of interacting phenomena (multi-model data resulting from coupled simulation models). Also, data can be of different dimensionality or structured on various types of grids that need to be related or fused in the visualization. This heterogeneity of data characteristics presents new opportunities as well as technical challenges for visualization research. Visualization and interaction techniques are thus often combined with computational analysis. In this survey, we study existing methods for visualization and interactive visual analysis of multi-faceted scientific data. Based on a thorough literature review, a categorization of approaches is proposed. We cover a wide range of fields and discuss to which degree the different challenges are matched with existing solutions for visualization and visual analysis. This leads to conclusions with respect to promising research directions, for instance, to pursue new solutions for multi-run and multi-model data as well as techniques that support a multitude of facets.Additional Files and Images


Weblinks
BibTeX
@article{Kehrer-2013-STAR,
  title =      "Visualization and Visual Analysis of Multi-faceted
               Scientific Data: A Survey",
  author =     "Johannes Kehrer and Helwig Hauser",
  year =       "2013",
  abstract =   "Visualization and visual analysis play important roles in
               exploring, analyzing and presenting scientific data. In many
               disciplines, data and model scenarios are becoming
               multi-faceted: data are often spatio-temporal and
               multi-variate; they stem from different data sources
               (multi-modal data),   from multiple simulation runs
               (multi-run/ensemble data), or from multi-physics simulations
               of interacting phenomena (multi-model data resulting from
               coupled simulation models). Also, data can be of different
               dimensionality or structured on various types of grids that
               need to be related or fused in the visualization. This
               heterogeneity of data characteristics presents new
               opportunities as well as technical challenges for
               visualization research. Visualization and interaction
               techniques are thus often combined with computational
               analysis. In this survey, we study existing methods for
               visualization and interactive visual analysis of
               multi-faceted scientific data. Based on a thorough
               literature review, a categorization of approaches is
               proposed. We cover a wide range of fields and discuss to
               which degree the different challenges are matched with
               existing solutions for visualization and visual analysis.
               This leads to conclusions with respect to promising research
               directions, for instance, to pursue new solutions for
               multi-run and multi-model data as well as techniques that
               support a multitude of facets.",
  month =      mar,
  issn =       "1077-2626",
  journal =    "IEEE Transactions on Visualization and Computer Graphics",
  note =       "Spotlight paper of the March issue of TVCG",
  number =     "3",
  volume =     "19",
  pages =      "495--513",
  URL =        "https://www.cg.tuwien.ac.at/research/publications/2013/Kehrer-2013-STAR/",
}