

Philipp Muigg
Scalability for Volume Rendering and Information Visualization Approaches in the Context of Scientific Data
Supervisor: Eduard Gröller
Duration: 2007 — 2012
[ Thesis]
Information
- Publication Type: PhD-Thesis
- Workgroup(s)/Project(s):
- Date: 2012
- Date (Start): 2007
- Date (End): 2012
- TU Wien Library:
- 1st Reviewer: Eduard Gröller
- 2nd Reviewer: Markus Hadwiger
- Rigorosum: 15. June 2012
- First Supervisor: Eduard Gröller
Abstract
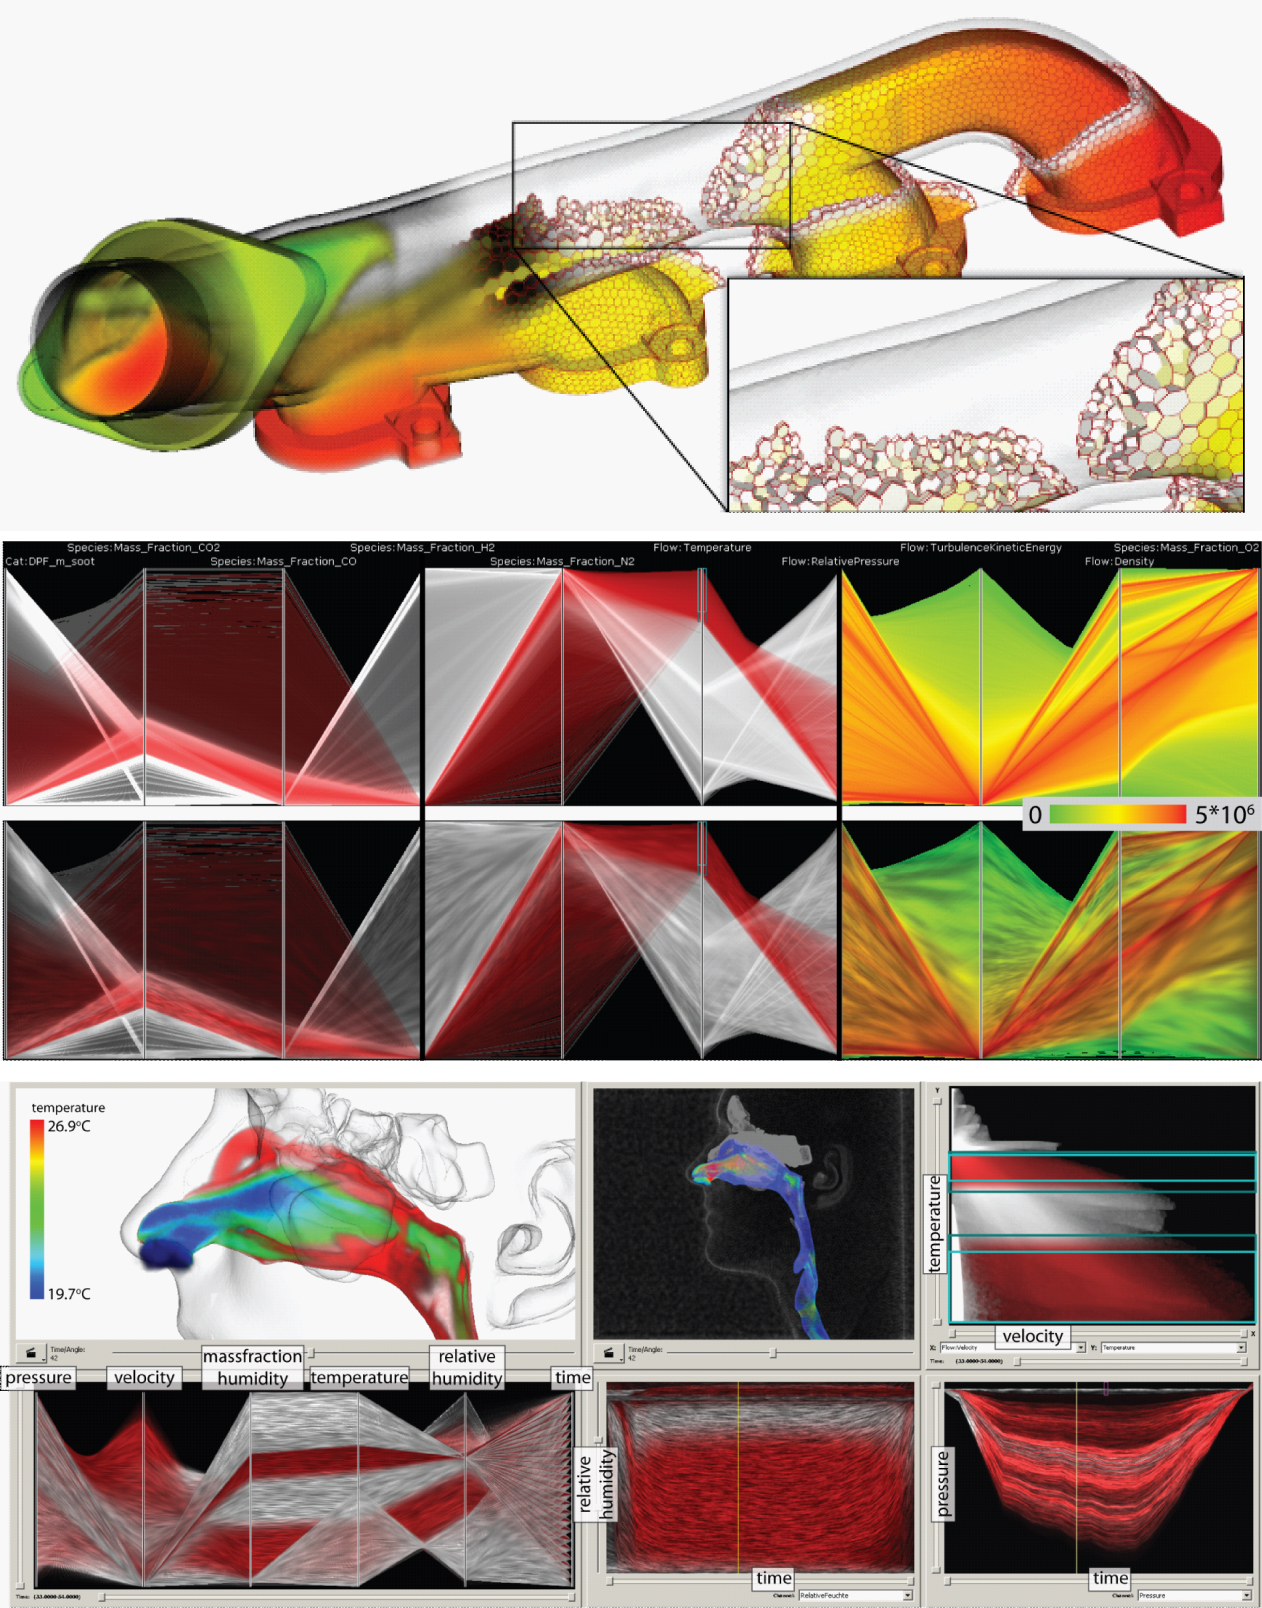
Data from numerical simulations that model physical processes has to be explored and analyzed in a broad range of different fields of research and development. Besides data mining and statistics, visualization is among the most important methods that grant domain experts insight into their complex simulation results. In order to keep up with ongoing improvements of simulation methods as well as ever increasing amounts of data, state-of-the-art visualization techniques have to be scalable with respect to many different properties. Many numerical models rely on a domain decomposition defined by a volumetric grid. Finer grids yield more accurate simulation results at the cost of longer computing times. The wide availability of high-performance computing resources has resulted in increasingly detailed data sets. The first volume rendering approach that is presented in this thesis uses bricking and resampling to cope with such high resolution data. Important regions of the simulated volume are visualized in as much detail as possible whereas lower resolution representations are used for less important portions of a data set. This allows for interactive frame rates even when dealing with the highly detailed grids that are used by state-of-the-art simulation models. Grid resolution, however, is only one aspect that has increased due to the ongoing development of numerical methods. Grid complexity has increased as well. While initial simulation techniques have required simple tetrahedral meshes current methods can cope with polyhedral cells that allow for increased solver efficiency and simulation accuracy. The second volume visualization algorithm that is presented in this thesis is scalable with respect to grid complexity since it is capable of directly visualizing data defined on grids which comprise polyhedral cells. Raycasting is performed by using a novel data structure that allows for easy grid traversal while retaining a very compact memory footprint. Both aforementioned volume rendering techniques utilize the massively parallel computing resources that are provided by modern graphics processing units. Many information visualization methods are designed to explore and analyze abstract data that is often high dimensional. Since improvements in the field of numerical modelling have led to simulation data sets that contain a large number of physical attributes the application of techniques from the field of information visualization can provide additional important information to domain experts. However, in order to apply information visualization methods to scientific data such as numerical simulation results, additional scalability issues have to be addressed. This thesis introduces multiple methods that can be used to reduce cluttering and overdrawing problems for line-based techniques such as phase-space diagrams, parallel coordinates and a novel time-series visualization. The trajectories of important trends in the data are illustrated by blurring a noise texture along them. A novel coloring scheme is used to provide visual linking-information across multiple visualizations in a multi-view framework. The proposed approaches are primarily image-based which makes them very scalable with respect to data set sizes. The usefulness and real-world applicability of the techniques that are introduced in this thesis is demonstrated in a case study. A complex computational fluid dynamics data set, which contains several simulated breathing cycles within the human upper respiratory tract, is analyzed. The exploration of the data has yielded several hypothesis that are of importance to an ENT specialist. Many of the techniques presented in this work have also been used in the context of additional collaborations in a multitude of fields such as medicine, climatology, meteorology, and engineering.Additional Files and Images

Weblinks
No further information available.BibTeX
@phdthesis{muigg-2012-svr,
  title =      "Scalability for Volume Rendering and Information
               Visualization Approaches in the Context of Scientific Data",
  author =     "Philipp Muigg",
  year =       "2012",
  abstract =   "Data from numerical simulations that model physical
               processes has to be explored and analyzed in a broad range
               of different fields of research and development. Besides
               data mining and statistics, visualization is among the most
               important methods that grant domain experts insight into
               their complex simulation results. In order to keep up with
               ongoing improvements of simulation methods as well as ever
               increasing amounts of data, state-of-the-art visualization
               techniques have to be scalable with respect to many
               different properties. Many numerical models rely on a domain
               decomposition defined by a volumetric grid. Finer grids
               yield more accurate simulation results at the cost of longer
               computing times. The wide availability of high-performance
               computing resources has resulted in increasingly detailed
               data sets. The first volume rendering approach that is
               presented in this thesis uses bricking and resampling to
               cope with such high resolution data. Important regions of
               the simulated volume are visualized in as much detail as
               possible whereas lower resolution representations are used
               for less important portions of a data set. This allows for
               interactive frame rates even when dealing with the highly
               detailed grids that are used by state-of-the-art simulation
               models. Grid resolution, however, is only one aspect that
               has increased due to the ongoing development of numerical
               methods. Grid complexity has increased as well. While
               initial simulation techniques have required simple
               tetrahedral meshes current methods can cope with polyhedral
               cells that allow for increased solver efficiency and
               simulation accuracy. The second volume visualization
               algorithm that is presented in this thesis is scalable with
               respect to grid complexity since it is capable of directly
               visualizing data defined on grids which comprise polyhedral
               cells. Raycasting is performed by using a novel data
               structure that allows for easy grid traversal while
               retaining a very compact memory footprint. Both
               aforementioned volume rendering techniques utilize the
               massively parallel computing resources that are provided by
               modern graphics processing units. Many information
               visualization methods are designed to explore and analyze
               abstract data that is often high dimensional. Since
               improvements in the field of numerical modelling have led to
               simulation data sets that contain a large number of physical
               attributes the application of techniques from the field of
               information visualization can provide additional important
               information to domain experts. However, in order to apply
               information visualization methods to scientific data such as
               numerical simulation results, additional scalability issues
               have to be addressed. This thesis introduces multiple
               methods that can be used to reduce cluttering and
               overdrawing problems for line-based techniques such as
               phase-space diagrams, parallel coordinates and a novel
               time-series visualization. The trajectories of important
               trends in the data are illustrated by blurring a noise
               texture along them. A novel coloring scheme is used to
               provide visual linking-information across multiple
               visualizations in a multi-view framework. The proposed
               approaches are primarily image-based which makes them very
               scalable with respect to data set sizes. The usefulness and
               real-world applicability of the techniques that are
               introduced in this thesis is demonstrated in a case study. A
               complex computational fluid dynamics data set, which
               contains several simulated breathing cycles within the human
               upper respiratory tract, is analyzed. The exploration of the
               data has yielded several hypothesis that are of importance
               to an ENT specialist. Many of the techniques presented in
               this work have also been used in the context of additional
               collaborations in a multitude of fields such as medicine,
               climatology, meteorology, and engineering.",
  address =    "Favoritenstrasse 9-11/E193-02, A-1040 Vienna, Austria",
  school =     "Institute of Computer Graphics and Algorithms, Vienna
               University of Technology ",
  URL =        "https://www.cg.tuwien.ac.at/research/publications/2012/muigg-2012-svr/",
}