

Andreas Reh, B Plank, J Kastner, Eduard Gröller , Christoph Heinzl
Porosity Maps – Interactive Exploration and Visual Analysis of Porosity in Carbon Fiber Reinforced Polymers
Computer Graphics Forum,, 31(3):1185-1194, June 2012. [ paper]
Information
- Publication Type: Journal Paper with Conference Talk
- Workgroup(s)/Project(s):
- Date: June 2012
- Journal: Computer Graphics Forum,
- Volume: 31
- Number: 3
- Location: Vienna, Austria
- Lecturer: Andreas Reh
- Event: Euro Vis 2012
- Conference date: 5. June 2012 – 8. June 2012
- Pages: 1185 – 1194
- Keywords: Interaction Techniques, Methodology and techniques
Abstract
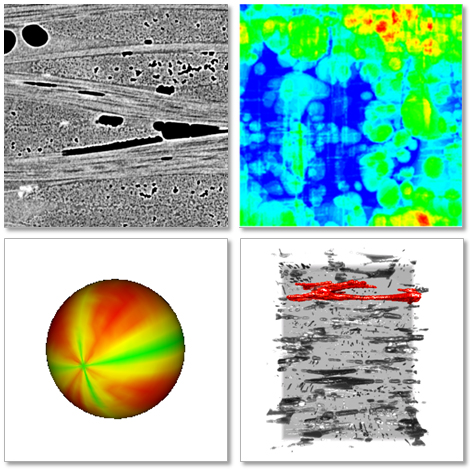
In this work a novel method for the characterization of porosity in carbon fiber reinforced polymers (CFRP) is presented. A visualization pipeline for the interactive exploration and visual analysis of CFRP specimens is developed to enhance the evaluation workflow for non-destructive testing (NDT) practitioners based on specified tasks. Besides quantitative porosity determination and the calculation of local pore properties, i.e., volume, surface, dimensions and shape factors, we employ a drill-down approach to explore pores in a CFRP specimen. We introduce Porosity Maps (PM), to allow for a fast porosity evaluation of the specimen. Pores are filtered in two stages. First a region of interest is selected in the porosity maps. Second, pores are filtered with parallel coordinates according to their local properties. Furthermore a histogram-based best-viewpoint widget was implemented to visualize the quality of viewpoints on a sphere. The advantages of our approach are demonstrated using real world CFRP specimens. We are able to show that our visualization-driven approach leads to a better evaluation of CFRP components than existing reference methods.Additional Files and Images

Weblinks
BibTeX
@article{PMI_AR_2012,
  title =      "Porosity Maps – Interactive Exploration and Visual
               Analysis of Porosity in Carbon Fiber Reinforced Polymers",
  author =     "Andreas Reh and B Plank and J Kastner and Eduard Gr\"{o}ller
               and Christoph Heinzl",
  year =       "2012",
  abstract =   "In this work a novel method for the characterization of
               porosity in carbon fiber reinforced polymers (CFRP) is
               presented. A visualization pipeline for the interactive
               exploration and visual analysis of CFRP specimens is
               developed to enhance the evaluation workflow for
               non-destructive testing (NDT) practitioners based on
               specified tasks. Besides quantitative porosity determination
               and the calculation of local pore properties, i.e., volume,
               surface, dimensions and shape factors, we employ a
               drill-down approach to explore pores in a CFRP specimen. We
               introduce Porosity Maps (PM), to allow for a fast porosity
               evaluation of the specimen. Pores are filtered in two
               stages. First a region of interest is selected in the
               porosity maps. Second, pores are filtered with parallel
               coordinates according to their local properties. Furthermore
               a histogram-based best-viewpoint widget was implemented to
               visualize the quality of viewpoints on a sphere. The
               advantages of our approach are demonstrated using real world
               CFRP specimens. We are able to show that our
               visualization-driven approach leads to a better evaluation
               of CFRP components than existing reference methods.",
  month =      jun,
  journal =    "Computer Graphics Forum,",
  volume =     "31",
  number =     "3",
  pages =      "1185--1194",
  keywords =   "Interaction Techniques, Methodology and techniques",
  URL =        "https://www.cg.tuwien.ac.at/research/publications/2012/PMI_AR_2012/",
}