

Marius Gavrilescu
Visualization and Graphical Processing of Volume Data
Supervisor: Vasile Manta
Duration: October 2008 — October 2011
[ Thesis]
Information
- Publication Type: PhD-Thesis
- Workgroup(s)/Project(s):
- Date: October 2011
- Date (Start): October 2008
- Date (End): October 2011
- TU Wien Library:
- 1st Reviewer:
- Vasile Manta
- Eduard Gröller

- 2nd Reviewer:
- Prof. Dr. Florica Moldoveanu
- Prof. Dr. Octavian Pastravanu
- Prof. Dr. Gheorghe Grigoras
- Rigorosum: 17. October 2011
- First Supervisor: Vasile Manta
- Keywords: parameter stability, left ventricle, cardiac parameters, feature enhancement, transfer function, volume rendering, visualization, user interface
Abstract
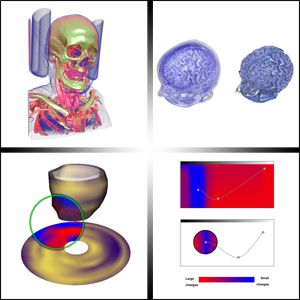
The extraction and visualization of information from volume data constitute important research avenues in computer graphics and imaging. The rapid development of GPUs with increasing computational power has made it possible to generate intuitive, three-dimensional representations of data sets, which can be tweaked and manipulated interactively.This thesis presents various techniques developed within the field of volume graphics. These have wide applicability in the generation of meaningful images from mainly CT and MRI data sets. The work addresses multiple aspects of volume visualization and rendering, such as the representation, classification and in-depth graphical analysis of the information contained within volume data. Initially, we present generic information on the nature of volume data, the mathematical and physical models behind volume rendering, as well as the rendering algorithms used within our prototyping framework for the rendering of images. Subsequently, we address the problem of volume classification, where we explore the use of various types of transfer functions. These operate on voxel properties such as the gradient, curvature or visibility, allowing for the isolation of increasingly complex and problematic features. We provide alternative, more computationally-efficient ways of approximating some of these properties and show how they can be used for classification purposes. We also provide an effective way of specifying multidimensional transfer functions from 1D components, thus increasing the flexibility and expanding the potential of the classification process.
Another part of the thesis deals with cardiac MRI data. Specifically, we develop a tool for the visual inspection of parameters which influence the status and functionality of the left ventricle. The considered parameters are the thickness and thickening of the myocardial wall, the moment of maximum thickness and the average speed of the wall during a cardiac cycle. Starting from segmentation contours which outline the epicardium and endocardium, we construct surfaces and use these to visualize the distribution of parameter values using color coding. The technique allows for information from multiple slices, over multiple phases and stress levels to be represented on a single 3D geometry, therefore facilitating the analysis of multidimensional data sets comprising a large number of slices. The values of the cardiac parameters are depicted in an intuitive manner, making them easily accessible to both medical staff and patients with no medical training. In the last part of the thesis we develop a method for the analysis of parameters involved in the volume rendering pipeline. The technique involves sampling the parameters across their domains, rendering images for each sample, and computing the differences among these images. The resulting values characterize the behavior and stability of the parameters across their domains. These values are further used to augment various user interfaces, such as sliders or transfer function specification widgets. The newly-modified interfaces use color coding, graphs, arrows and other info-vis techniques to show the potential changes induced by the parameters in images resulting from volume rendering, thus allowing users to make better-informed decisions when adjusting parameter values.
Additional Files and Images

Weblinks
No further information available.BibTeX
@phdthesis{Gavrilescu_2011_VGP,
  title =      "Visualization and Graphical Processing of Volume Data",
  author =     "Marius Gavrilescu",
  year =       "2011",
  abstract =   "The extraction and visualization of information from volume
               data constitute important research avenues in computer
               graphics and imaging.  The rapid development of GPUs with
               increasing computational power has made it possible to
               generate intuitive, three-dimensional representations of
               data sets, which can be tweaked and manipulated
               interactively.   This thesis presents various techniques
               developed within the field of volume graphics. These have
               wide applicability in the generation of meaningful images
               from mainly CT and MRI data sets. The work addresses
               multiple aspects of volume visualization and rendering, such
               as the representation, classification and in-depth graphical
               analysis of the information contained within volume data.
               Initially, we present generic information on the nature of
               volume data, the mathematical and physical models behind
               volume rendering, as well as the rendering algorithms used
               within our prototyping framework for the rendering of
               images. Subsequently, we address the problem of volume
               classification, where we explore the use of various types of
               transfer functions. These operate on voxel properties such
               as the gradient, curvature or visibility, allowing for the
               isolation of increasingly complex and problematic features.
               We provide alternative, more computationally-efficient ways
               of approximating some of these properties and show how they
               can be used for classification purposes. We also provide an
               effective way of specifying multidimensional transfer
               functions from 1D components, thus increasing the
               flexibility and expanding the potential of the
               classification process.  Another part of the thesis deals
               with cardiac MRI data. Specifically, we develop a tool for
               the visual inspection of parameters which influence the
               status and functionality of the left ventricle. The
               considered parameters are the thickness and thickening of
               the myocardial wall, the moment of maximum thickness and the
               average speed of the wall during a cardiac cycle. Starting
               from segmentation contours which outline the epicardium and
               endocardium, we construct surfaces and use these to
               visualize the distribution of parameter values using color
               coding. The technique allows for information from multiple
               slices, over multiple phases and stress levels to be
               represented on a single 3D geometry, therefore facilitating
               the analysis of multidimensional data sets comprising a
               large number of slices. The values of the cardiac parameters
               are depicted in an intuitive manner, making them easily
               accessible to both medical staff and patients with no
               medical training.  In the last part of the thesis we develop
               a method for the analysis of parameters involved in the
               volume rendering pipeline. The technique involves sampling
               the parameters across their domains, rendering images for
               each sample, and computing the differences among these
               images. The resulting values characterize the behavior and
               stability of the parameters across their domains. These
               values are further used to augment various user interfaces,
               such as sliders or transfer function specification widgets.
               The newly-modified interfaces use color coding, graphs,
               arrows and other info-vis techniques to show the potential
               changes induced by the parameters in images resulting from
               volume rendering, thus allowing users to make
               better-informed decisions when adjusting parameter values.
               ",
  month =      oct,
  address =    "Favoritenstrasse 9-11/E193-02, A-1040 Vienna, Austria",
  school =     "Institute of Computer Graphics and Algorithms, Vienna
               University of Technology ",
  keywords =   "parameter stability, left ventricle, cardiac parameters,
               feature enhancement, transfer function, volume rendering,
               visualization, user interface",
  URL =        "https://www.cg.tuwien.ac.at/research/publications/2011/Gavrilescu_2011_VGP/",
}