

Peter Rautek
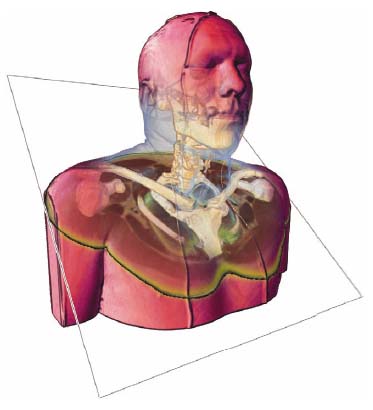
Semantic Visualization Mapping for Volume Illustration
Supervisor: Eduard Gröller
Duration: November 2005 — January 2009
[image] [ paper]
Information
- Publication Type: PhD-Thesis
- Workgroup(s)/Project(s):
- Date: 2009
- Date (Start): November 2005
- Date (End): January 2009
- TU Wien Library:
- Second Supervisor: Ivan Viola
- Rigorosum: 27. January 2009
- First Supervisor: Eduard Gröller
Abstract
Scientific visualization is the discipline of automatically rendering images from scientific data. Adequate visual abstractions are important to show relevant information in the data. Visual abstractions are a trade-off between showing detailed information and preventing visual overload. To use visual abstractions for the depiction of data, a mapping from data attributes to visual abstractions is needed. This mapping is called the visualization mapping. This thesis reviews the history of visual abstractions and visualizationmapping in the context of scientific visualization. Later a novel visual abstraction method called caricaturistic visualization is presented. The concept of exaggeration is the visual abstraction used for caricaturistic visualization. Principles from traditional caricatures are used to accentuate salient details of data while sparsely sketching the context. The visual abstractions described in this thesis are inspired by visual art and mostly by traditional illustration techniques. To make effective use of the recently developed visualizationmethods, that imitate illustration techniques, an expressive visualization mapping approach is required. In this thesis a visualization mapping method is investigated that makes explicit use of semantics to describe mappings from data attributes to visual abstractions. The semantic visualization mapping explicitly uses domain semantics and visual abstraction semantics to specify visualization rules. Illustrative visualization results are shown that are achieved with the semantic visualization mapping. The behavior of the automatically rendered interactive illustrations is specified using interaction-dependent visualization rules. Interactions like the change of the viewpoint, or the manipulation of a slicing plane are state of the art in volume visualization. In this thesis a method for more elaborate interaction techniques is presented. The behavior of the illustrations is specified with interaction-dependent rules that are integrated in the semantic visualization mapping approach.Additional Files and Images

Weblinks
No further information available.BibTeX
@phdthesis{rautek-2009-vmv,
  title =      "Semantic Visualization Mapping for Volume Illustration",
  author =     "Peter Rautek",
  year =       "2009",
  abstract =   "Scientific visualization is the discipline of automatically
               rendering images from scientific data. Adequate visual
               abstractions are important to show relevant information in
               the data. Visual abstractions are a trade-off between
               showing detailed information and preventing visual overload.
               To use visual abstractions for the depiction of data, a
               mapping from data attributes to visual abstractions is
               needed. This mapping is called the visualization mapping.
               This thesis reviews the history of visual abstractions and
               visualizationmapping in the context of scientific
               visualization. Later a novel visual abstraction method
               called caricaturistic visualization is presented. The
               concept of exaggeration is the visual abstraction used for
               caricaturistic visualization. Principles from traditional
               caricatures are used to accentuate salient details of data
               while sparsely sketching the context. The visual
               abstractions described in this thesis are inspired by visual
               art and mostly by traditional illustration techniques. To
               make effective use of the recently developed
               visualizationmethods, that imitate illustration techniques,
               an expressive visualization mapping approach is required. In
               this thesis a visualization mapping method is investigated
               that makes explicit use of semantics to describe mappings
               from data attributes to visual abstractions. The semantic
               visualization mapping explicitly uses domain semantics and
               visual abstraction semantics to specify visualization rules.
               Illustrative visualization results are shown that are
               achieved with the semantic visualization mapping. The
               behavior of the automatically rendered interactive
               illustrations is specified using interaction-dependent
               visualization rules. Interactions like the change of the
               viewpoint, or the manipulation of a slicing plane are state
               of the art in volume visualization. In this thesis a method
               for more elaborate interaction techniques is presented. The
               behavior of the illustrations is specified with
               interaction-dependent rules that are integrated in the
               semantic visualization mapping approach.",
  address =    "Favoritenstrasse 9-11/E193-02, A-1040 Vienna, Austria",
  school =     "Institute of Computer Graphics and Algorithms, Vienna
               University of Technology ",
  URL =        "https://www.cg.tuwien.ac.at/research/publications/2009/rautek-2009-vmv/",
}