

Harald Piringer, M. Buchetics, Helwig Hauser , Eduard Gröller
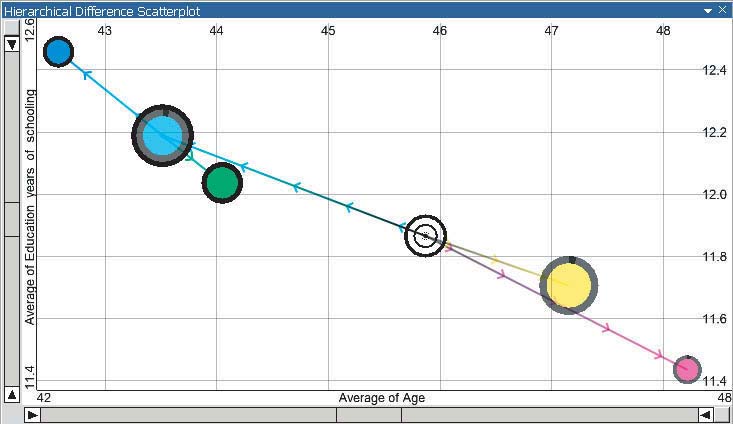
Hierarchical Difference Scatterplots - Interactive Visual Analysis of Data Cubes
In Proceedings of the ACM SIGKDD Workshop on Visual Analytics and Knowledge Discovery (VAKD, pages 56-65. June 2009.
[image] [ paper]
Information
- Publication Type: Conference Paper
- Workgroup(s)/Project(s):
- Date: June 2009
- ISBN: 978-1-60558-670-0
- Publisher: ACM
- Location: Paris, France
- Lecturer: Harald Piringer
- Editor: Kai Puolamäki
- Booktitle: Proceedings of the ACM SIGKDD Workshop on Visual Analytics and Knowledge Discovery (VAKD
- Conference date: 28. June 2009 –
- Pages: 56 – 65
Abstract
Data cubes as employed by On-Line Analytical Processing (OLAP) play a key role in many application domains. The analysis typically involves to compare categories of different hierarchy levels with respect to size and pivoted values. Most existing visualization methods for pivoted values, however, are limited to single hierarchy levels. The main contribution of this paper is an approach called Hierarchical Difference Scatterplot (HDS). A HDS allows for relating multiple hierarchy levels and explicitly visualizes differences between them in the context of the absolute position of pivoted values. We discuss concepts of tightly coupling HDS to other types of tree visualizations and propose the integration in a setup of multiple views, which are linked by interactive queries on the data. We evaluate our approaches by analyzing social survey data in collaboration with a domain expert.Additional Files and Images

Weblinks
No further information available.BibTeX
@inproceedings{piringer-2009-hds,
  title =      "Hierarchical Difference Scatterplots - Interactive Visual
               Analysis of Data Cubes",
  author =     "Harald Piringer and M. Buchetics and Helwig Hauser and
               Eduard Gr\"{o}ller",
  year =       "2009",
  abstract =   "Data cubes as employed by On-Line Analytical Processing
               (OLAP) play a key role in many application domains. The
               analysis typically involves to compare categories of
               different hierarchy levels with respect to size and pivoted
               values. Most existing visualization methods for pivoted
               values, however, are limited to single hierarchy levels. The
               main contribution of this paper is an approach called
               Hierarchical Difference Scatterplot (HDS). A HDS allows for
               relating multiple hierarchy levels and explicitly visualizes
               differences between them in the context of the absolute
               position of pivoted values. We discuss concepts of tightly
               coupling HDS to other types of tree visualizations and
               propose the integration in a setup of multiple views, which
               are linked by interactive queries on the data. We evaluate
               our approaches by analyzing social survey data in
               collaboration with a domain expert.",
  month =      jun,
  isbn =       "978-1-60558-670-0",
  publisher =  "ACM",
  location =   "Paris, France",
  editor =     "Kai Puolam\"{a}ki",
  booktitle =  "Proceedings of the ACM SIGKDD Workshop on Visual Analytics
               and Knowledge Discovery (VAKD",
  pages =      "56--65",
  URL =        "https://www.cg.tuwien.ac.at/research/publications/2009/piringer-2009-hds/",
}