

Raphael Fuchs, Jürgen Waser, Eduard Gröller
Visual Human+Machine Learning
IEEE TVCG, 15(6):1327-1334, October 2009. [ Paper]
Information
- Publication Type: Journal Paper with Conference Talk
- Workgroup(s)/Project(s):
- Date: October 2009
- Journal: IEEE TVCG
- Volume: 15
- Number: 6
- Location: Atlantic City, New Jersey, USA
- Lecturer: Raphael Fuchs
- ISSN: 1077-2626
- Event: IEEE Visualization
- Conference date: 11. October 2009 – 16. October 2009
- Pages: 1327 – 1334
- Keywords: Volumetric Data, Interactive Visual Analysis, Knowledge Discovery, Genetic Algorithm, Curse of Dimensionality, Predictive Analysis, Computer-assisted Multivariate Data Expl, Multiple Competing Hypotheses
Abstract
In this paper we describe a novel method to integrate interactive visual analysis and machine learning to support the insight generation of the user. The suggested approach combines the vast search and processing power of the computer with the superior reasoning and pattern recognition capabilities of the human user. An evolutionary search algorithm has been adapted to assist in the fuzzy logic formalization of hypotheses that aim at explaining features inside multivariate, volumetric data. Up to now, users solely rely on their knowledge and expertise when looking for explanatory theories. However, it often remains unclear whether the selected attribute ranges represent the real explanation for the feature of interest. Other selections hidden in the large number of data variables could potentially lead to similar features. Moreover, as simulation complexity grows, users are confronted with huge multidimensional data sets making it almost impossible to find meaningful hypotheses at all. We propose an interactive cycle of knowledge-based analysis and automatic hypothesis generation. Starting from initial hypotheses, created with linking and brushing, the user steers a heuristic search algorithm to look for alternative or related hypotheses. The results are analyzed in information visualization views that are linked to the volume rendering. Individual properties as well as global aggregates are visually presented to provide insight into the most relevant aspects of the generated hypotheses. This novel approach becomes computationally feasible due to a GPU implementation of the time-critical parts in the algorithm. A thorough evaluation of search times and noise sensitivity as well as a case study on data from the automotive domain substantiate the usefulness of the suggested approach.Additional Files and Images
Additional images and videos
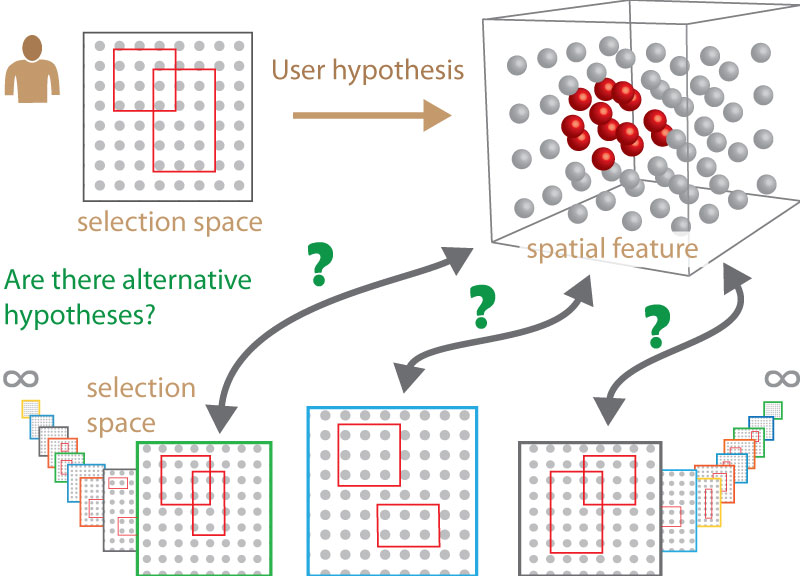 Image2:
Curse of dimensionality for IVA. In the space of all possible hypotheses it is not clear if the current one is the only candidate. This is a common problem engineers encounter when they use standard IVA methods (linking and brushing) for making sense of multidimensional simulation results. Secondly, searching for a hypothesis to explain a given spatial feature can be almost impossible for the user.
Image2:
Curse of dimensionality for IVA. In the space of all possible hypotheses it is not clear if the current one is the only candidate. This is a common problem engineers encounter when they use standard IVA methods (linking and brushing) for making sense of multidimensional simulation results. Secondly, searching for a hypothesis to explain a given spatial feature can be almost impossible for the user.
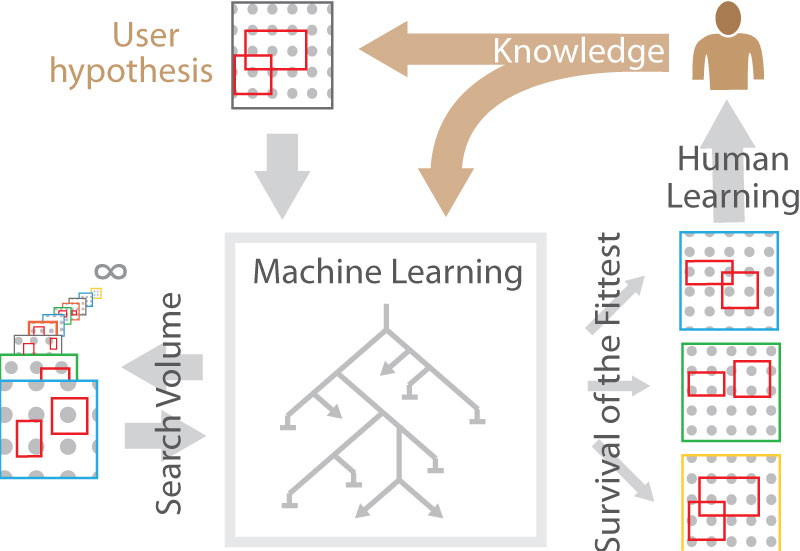 Image3:
We propose the extension of human learning with machine learning, comprising a genetic algorithm that efficiently searches for the best hypotheses available.
Image3:
We propose the extension of human learning with machine learning, comprising a genetic algorithm that efficiently searches for the best hypotheses available.
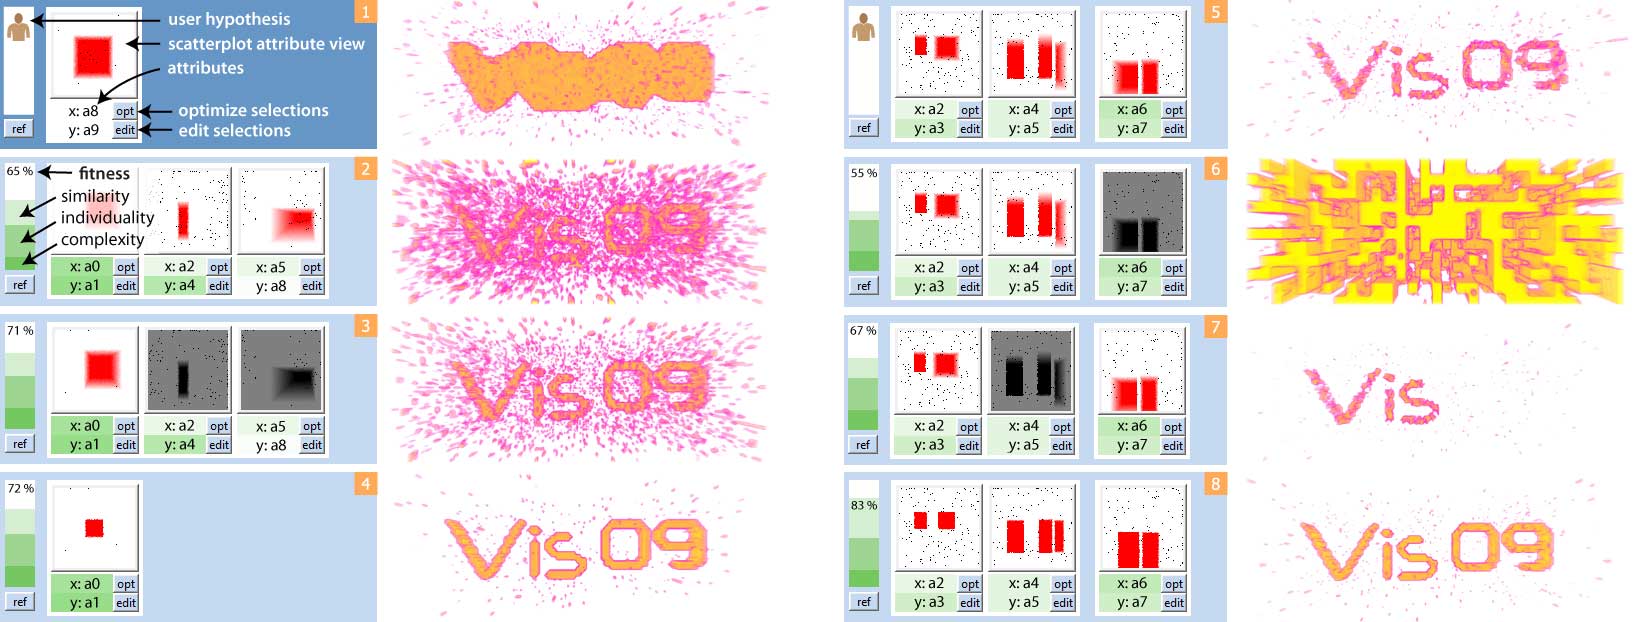 Image4:
Interaction example. (1) The user has the idea that attributes $a_8$ and $a_9$ describe a feature of interest. The resulting feature is shown in a rendering to the right. (2) The user runs the machine learning algorithm to search for hypotheses. The best resulting hypothesis has 65\% fitness. The coloring (dark green) shows that attributes $a_0$ and $a_1$ are important in the entire population. (3) The user deactivates genes on other attributes and the fitness increases. (4) Via interactive visual analysis, the user improves the hypothesis. It is still unclear whether there are alternative hypotheses. (5) A larger search has found an alternative hypothesis. (6) The alternative explanation consists of two clauses combined by conjunction (AND). If one of the two clauses is missing, the feature vanishes. (7) The first clause contains the disjunction (OR) of multiple selections. Attributes $a_2$, $a_3$ select the shape "Vis" only. (8) Automatic local optimization via hill climbing finds the optimal selections.
Image4:
Interaction example. (1) The user has the idea that attributes $a_8$ and $a_9$ describe a feature of interest. The resulting feature is shown in a rendering to the right. (2) The user runs the machine learning algorithm to search for hypotheses. The best resulting hypothesis has 65\% fitness. The coloring (dark green) shows that attributes $a_0$ and $a_1$ are important in the entire population. (3) The user deactivates genes on other attributes and the fitness increases. (4) Via interactive visual analysis, the user improves the hypothesis. It is still unclear whether there are alternative hypotheses. (5) A larger search has found an alternative hypothesis. (6) The alternative explanation consists of two clauses combined by conjunction (AND). If one of the two clauses is missing, the feature vanishes. (7) The first clause contains the disjunction (OR) of multiple selections. Attributes $a_2$, $a_3$ select the shape "Vis" only. (8) Automatic local optimization via hill climbing finds the optimal selections.
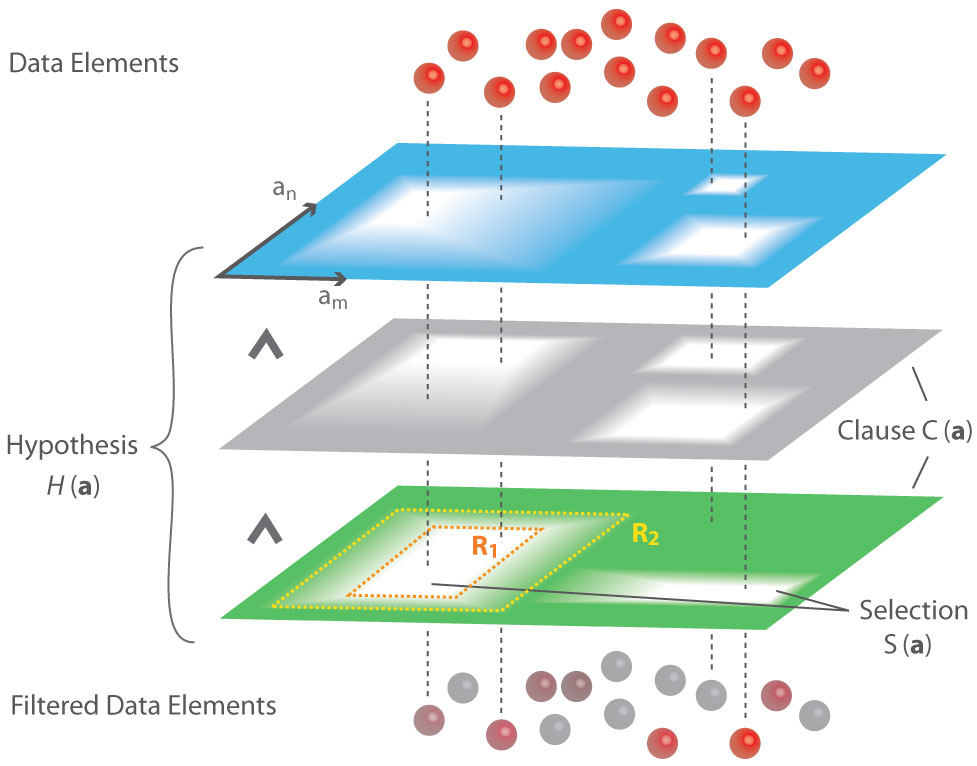 Image5:
Fuzzy logic hypotheses. The hypothesis is visualized as a stack of filter layers (clauses) with partially-transparent regions (fuzzy selections). The overlapping layers have a selective filter effect on the data items (spheres) above. While fully selected in the beginning (red), some of the spheres are being re-colored when falling through the stack. Less selected items receive higher desaturation, becoming grey if deselected.
Image5:
Fuzzy logic hypotheses. The hypothesis is visualized as a stack of filter layers (clauses) with partially-transparent regions (fuzzy selections). The overlapping layers have a selective filter effect on the data items (spheres) above. While fully selected in the beginning (red), some of the spheres are being re-colored when falling through the stack. Less selected items receive higher desaturation, becoming grey if deselected.
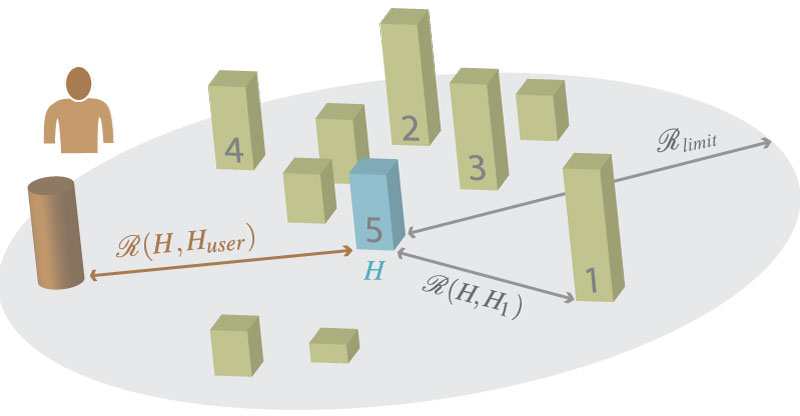 Image6:
Local ranking. For evaluating the rank of a hypothesis (grey number on the podiums), the current hypothesis (blue) is competing with its nearest neighbors in resemblance space. The higher its feature similarity (higher podium), the higher its rank. The individuality is then computed as the resemblance to the users hypothesis (brown), weighted with respect to the evaluated rank.
Image6:
Local ranking. For evaluating the rank of a hypothesis (grey number on the podiums), the current hypothesis (blue) is competing with its nearest neighbors in resemblance space. The higher its feature similarity (higher podium), the higher its rank. The individuality is then computed as the resemblance to the users hypothesis (brown), weighted with respect to the evaluated rank.
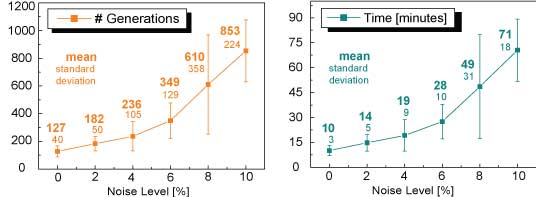 Image7:
Performance analysis: The search algorithm has been tested on synthetic data at different noise levels. The left graph shows the number of generations needed until a feature similarity of 0.8 has been reached. The right plot shows the related timing results.
Image7:
Performance analysis: The search algorithm has been tested on synthetic data at different noise levels. The left graph shows the number of generations needed until a feature similarity of 0.8 has been reached. The right plot shows the related timing results.
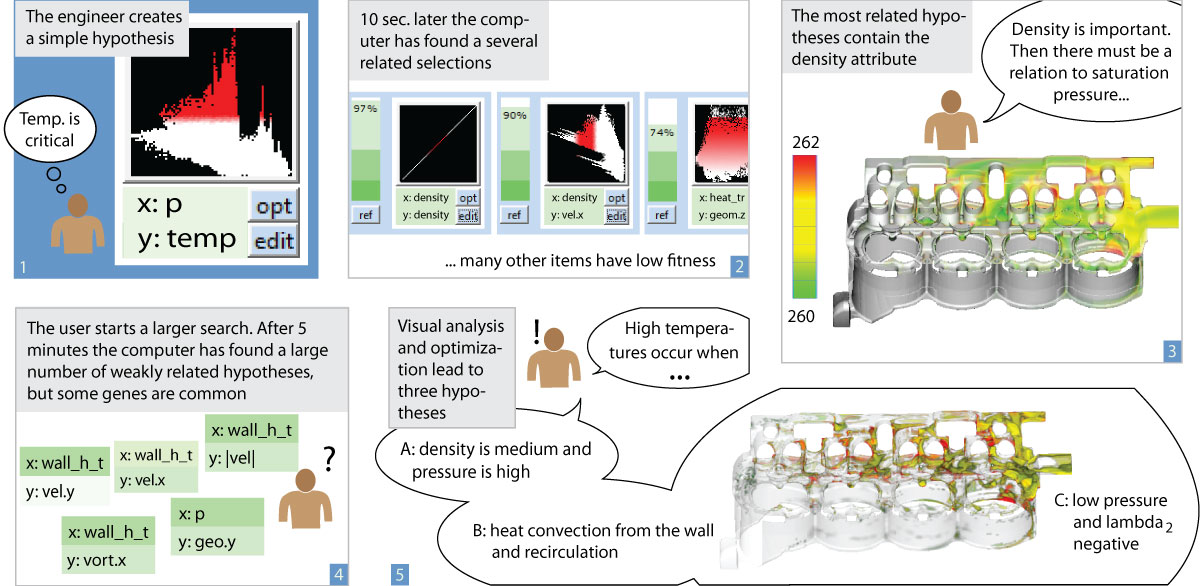 Image8:
Case study story: The engineer knows that there are critical temperatures inside the data set. An initial search shows that density and temperature are highly related since vaporized coolant has low density. The user adjusts his hypothesis to *hot AND vapor* and starts a larger search, but there is no single best solution. He analyzes the attribute ranges with the highest fitness and finds multiple hypotheses which can explain the hot temperatures at different locations in the data set. A: where pressure is high, the vapor could be compressed too much. B: where recirculation areas appear, the fluid transport could be hindered. C: vortex regions could trap hot fluid inside.
Image8:
Case study story: The engineer knows that there are critical temperatures inside the data set. An initial search shows that density and temperature are highly related since vaporized coolant has low density. The user adjusts his hypothesis to *hot AND vapor* and starts a larger search, but there is no single best solution. He analyzes the attribute ranges with the highest fitness and finds multiple hypotheses which can explain the hot temperatures at different locations in the data set. A: where pressure is high, the vapor could be compressed too much. B: where recirculation areas appear, the fluid transport could be hindered. C: vortex regions could trap hot fluid inside.
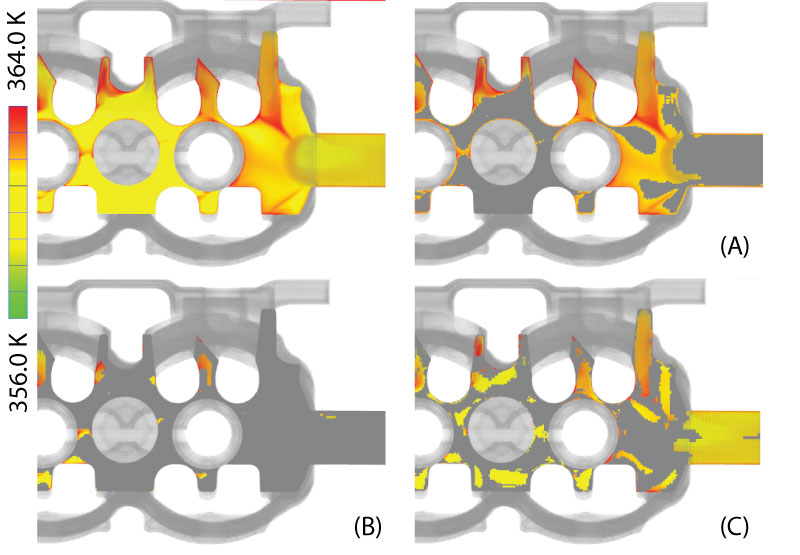 Image9:
Feature comparison: (top) Temperature distribution in a plane. (A-C) Selected areas correspond to the findings in Figure 8. We can see that the different variables explain different but partially overlapping subsets of the fluid.
Teaser:
Human + Machine
Image9:
Feature comparison: (top) Temperature distribution in a plane. (A-C) Selected areas correspond to the findings in Figure 8. We can see that the different variables explain different but partially overlapping subsets of the fluid.
Teaser:
Human + Machine
Additional files

Weblinks
No further information available.BibTeX
@article{fuchs_vhml,
  title =      "Visual Human+Machine Learning",
  author =     "Raphael Fuchs and J\"{u}rgen Waser and Eduard Gr\"{o}ller",
  year =       "2009",
  abstract =   "In this paper we describe a novel method to integrate
               interactive visual analysis and machine learning to support
               the insight generation of the user. The suggested approach
               combines the vast search and processing power of the
               computer with the superior reasoning and pattern recognition
               capabilities of the human user. An evolutionary search
               algorithm has been adapted to assist in the fuzzy logic
               formalization of hypotheses that aim at explaining features
               inside multivariate, volumetric data. Up to now, users
               solely rely on their knowledge and expertise when looking
               for explanatory theories. However, it often remains unclear
               whether the selected attribute ranges represent the real
               explanation for the feature of interest. Other selections
               hidden in the large number of data variables could
               potentially lead to similar features. Moreover, as
               simulation complexity grows, users are confronted with huge
               multidimensional data sets making it almost impossible to
               find meaningful hypotheses at all. We propose an interactive
               cycle of knowledge-based analysis and automatic hypothesis
               generation. Starting from initial hypotheses, created with
               linking and brushing, the user steers a heuristic search
               algorithm to look for alternative or related hypotheses. The
               results are analyzed in information visualization views that
               are linked to the volume rendering. Individual properties as
               well as global aggregates are visually presented to provide
               insight into the most relevant aspects of the generated
               hypotheses. This novel approach becomes computationally
               feasible due to a GPU implementation of the time-critical
               parts in the algorithm. A thorough evaluation of search
               times and noise sensitivity as well as a case study on data
               from the automotive domain substantiate the usefulness of
               the suggested approach.",
  month =      oct,
  journal =    "IEEE TVCG",
  volume =     "15",
  number =     "6",
  issn =       "1077-2626",
  pages =      "1327--1334",
  keywords =   "Volumetric Data, Interactive Visual Analysis, Knowledge
               Discovery, Genetic Algorithm, Curse of Dimensionality,
               Predictive Analysis, Computer-assisted Multivariate Data
               Expl, Multiple Competing Hypotheses",
  URL =        "https://www.cg.tuwien.ac.at/research/publications/2009/fuchs_vhml/",
}